Spain’s electrical system works with more than 10,000 indicators that are updated every moment.
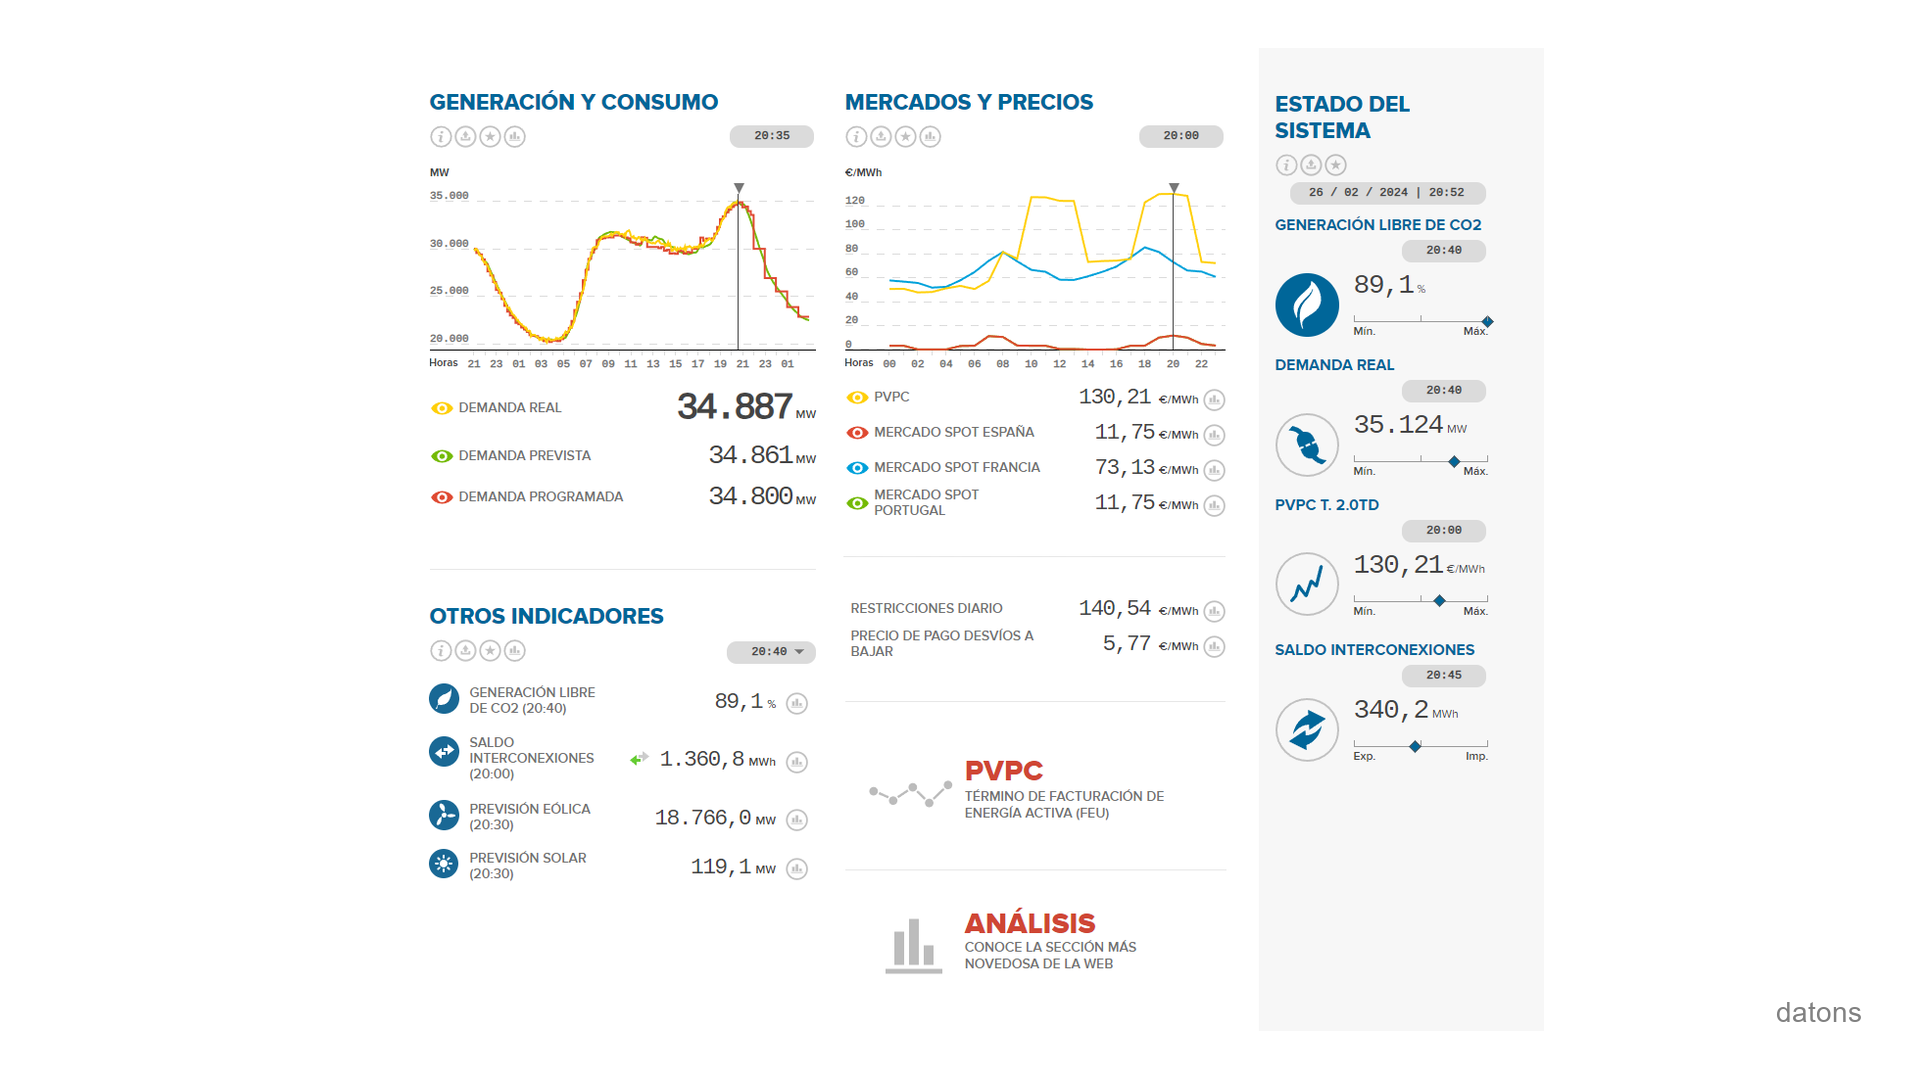
If you work with these indicators for your business processes, you’ll agree with me that using Excel with so much manual downloading, clicking here, clicking there is a real drag.
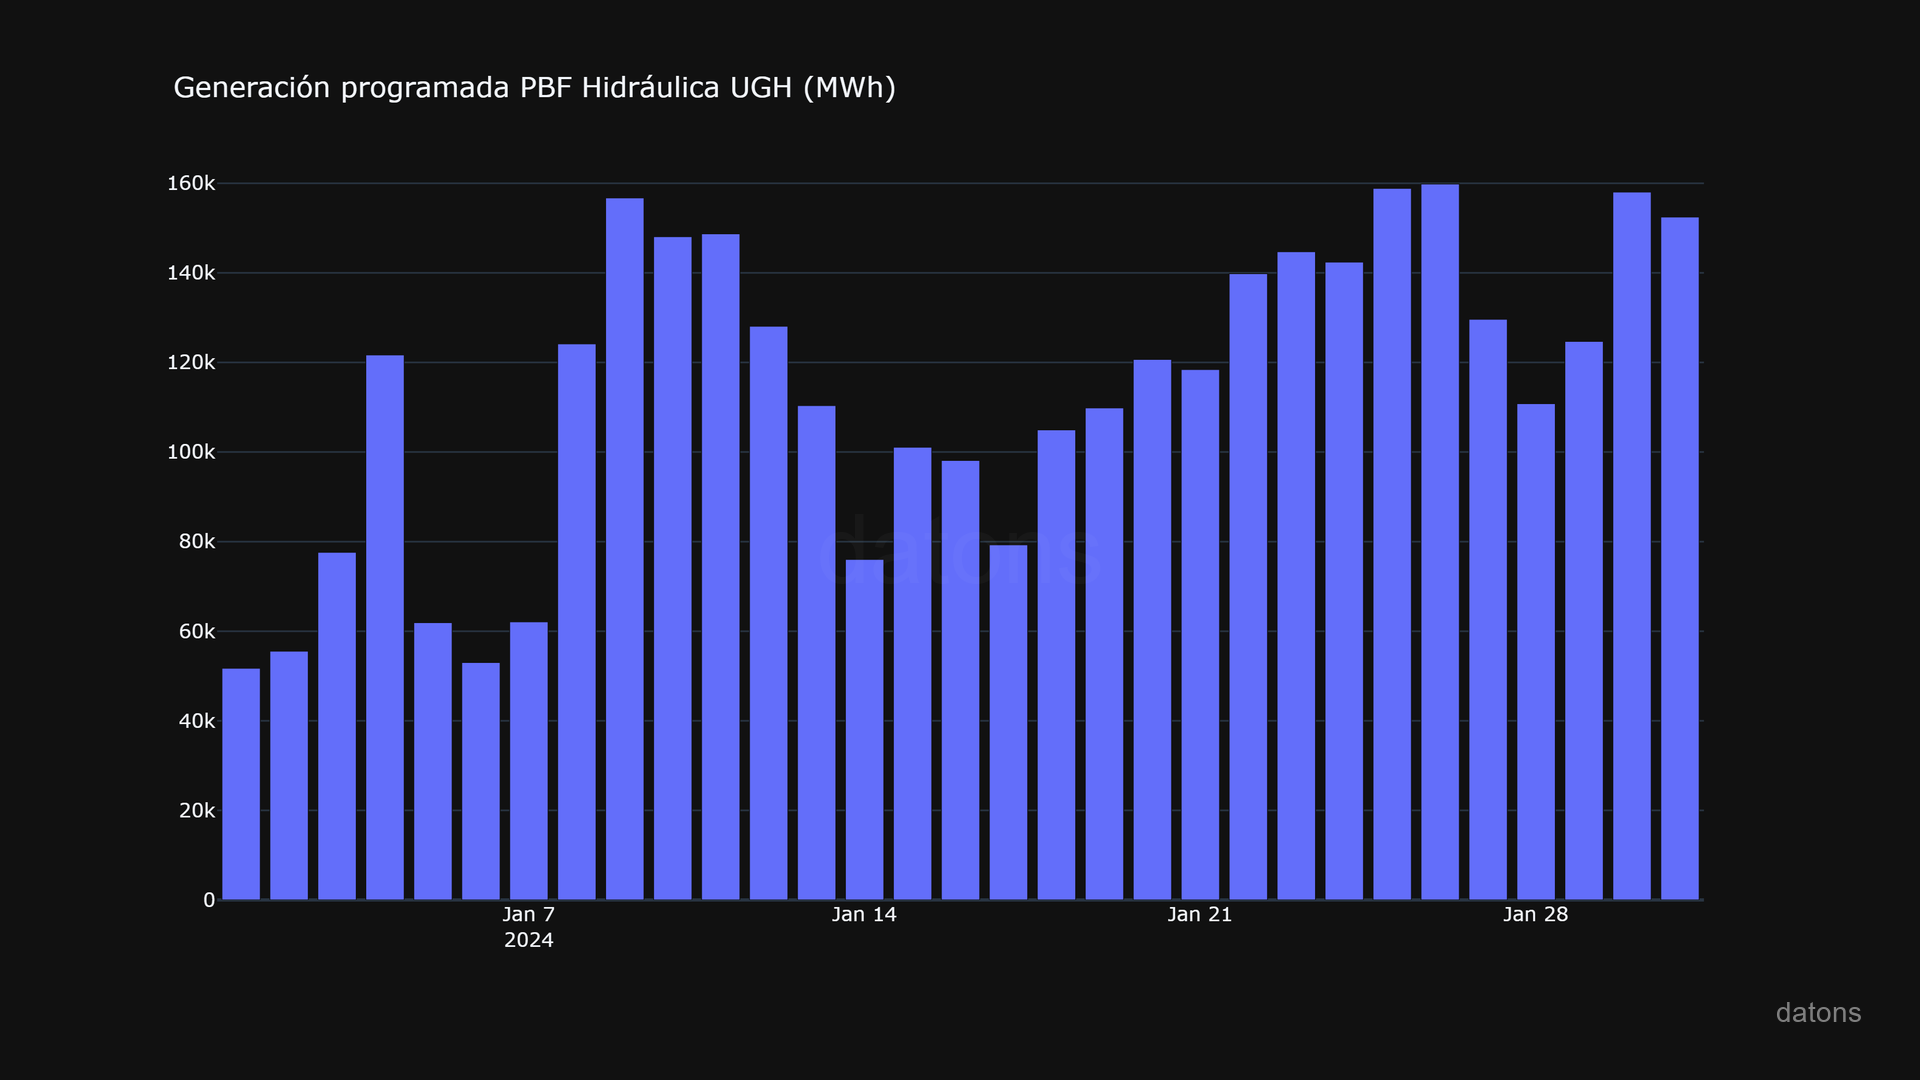
Imagine your company owns a hydroelectric plant and you want to analyze the Scheduled Generation PBF Hydraulic UGH indicator, how do you automate the download process with Python?
Questions
- How to obtain a token for the ESIOS API?
- What is an indicator in the ESIOS API and how do you access it?
- How are data from a specific indicator downloaded?
- How do you build a data table from the API response?
- How are the downloaded data processed and visualized with Python?
- How do you adjust the date range for data download?
Methodology
ESIOS API Token
To request information from the Red Eléctrica (REE) systems, you’ll need an authentication code (known in computer jargon as a token).
You must send an email to REE requesting the token to be associated with your email account (so they keep an eye on you in case you get heavy with too many API calls). Navigate to the official page and click on Personal token request to send the email.
API_TOKEN = 'YOUR_TOKEN'

headers = {
    'Host': 'api.esios.ree.es',
    'x-api-key': API_TOKEN
}
List of Indicators
To download the data for the Scheduled Generation PBF Hydraulic UGH indicator, we need the associated code. We’ll find it in the list of indicators provided by the API.
APIs work with URLs. Therefore, we create a url to
locate all the indicators.
URL_BASE = 'https://api.esios.ree.es/'
ENDPOINT = 'indicators/'

url = URL_BASE + ENDPOINT
We use the get function from the requests
library to obtain the resources from the url by validating
our call with the token stored in headers.
import requests

res = requests.get(url, headers=headers)
data = res.json()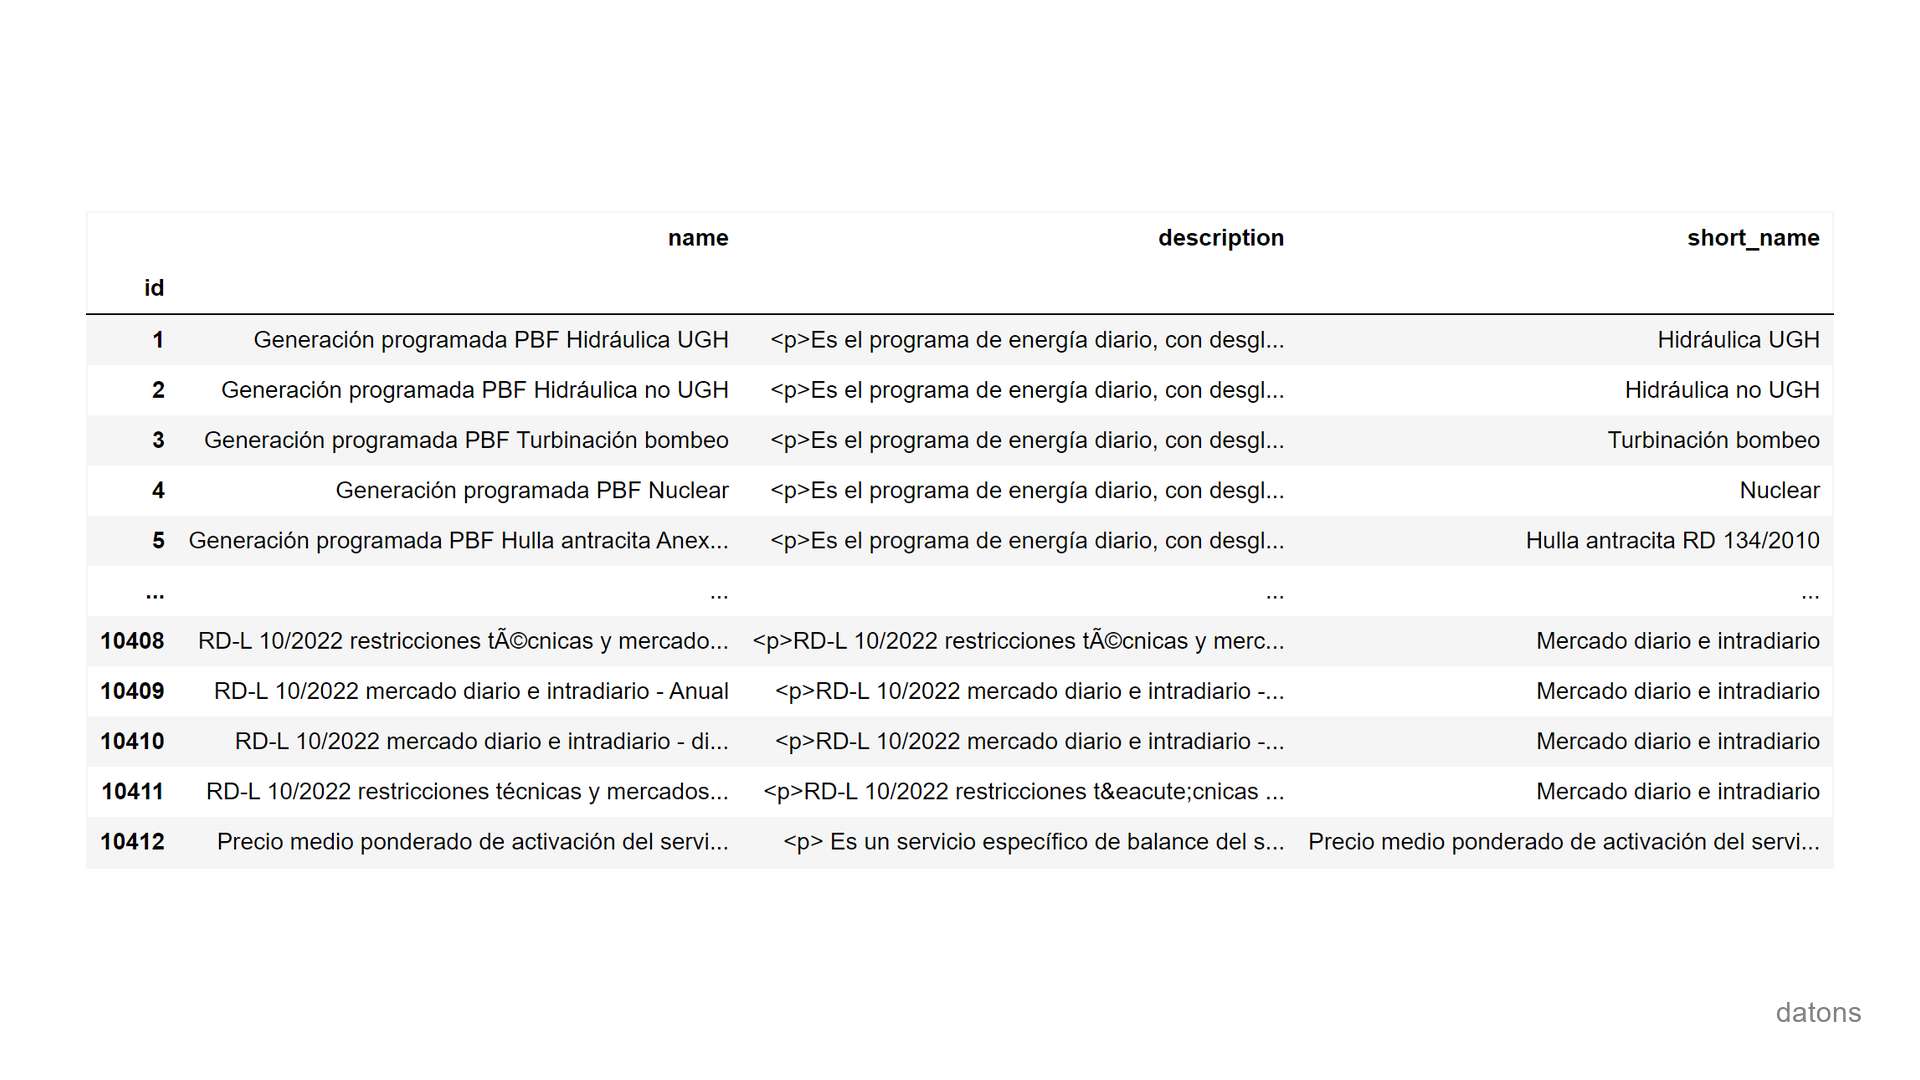
The id associated with the desired indicator is
1. Therefore, we add the code to the url.
INDICATOR = '1'
url = URL_BASE + ENDPOINT + INDICATOR
We make the call again and process the information with functions
from the pandas library to represent it in a table.
res = requests.get(url, headers=headers)
data = res.json()

df = pd.DataFrame(data['indicator']['values'])
df = df[['datetime_utc', 'geo_id', 'geo_name', 'value']]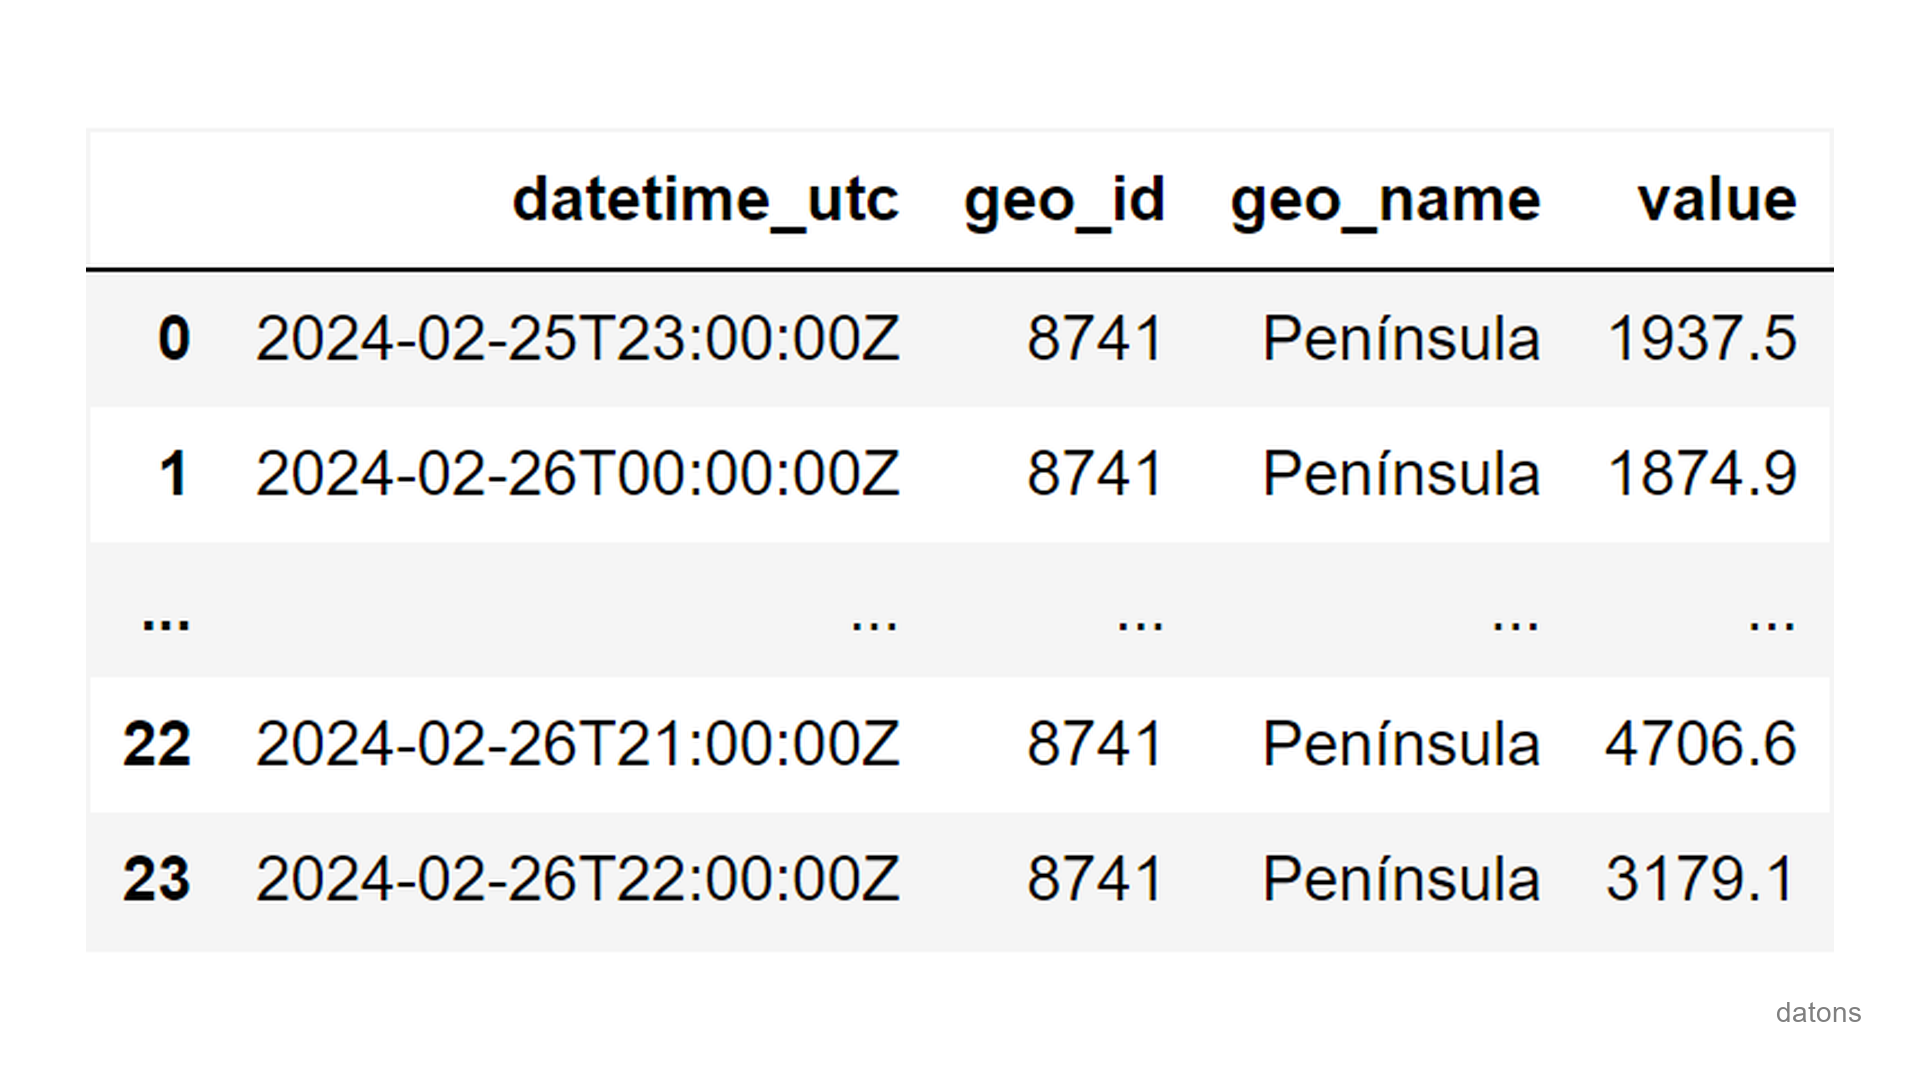
We only get data for one day. How could we obtain data for a month?
By adding parameters to the call.
params = {
    'start_date': '2024-01-01T00',
    'end_date': '2024-01-31T23'
}

res = requests.get(url, headers=headers, params=params)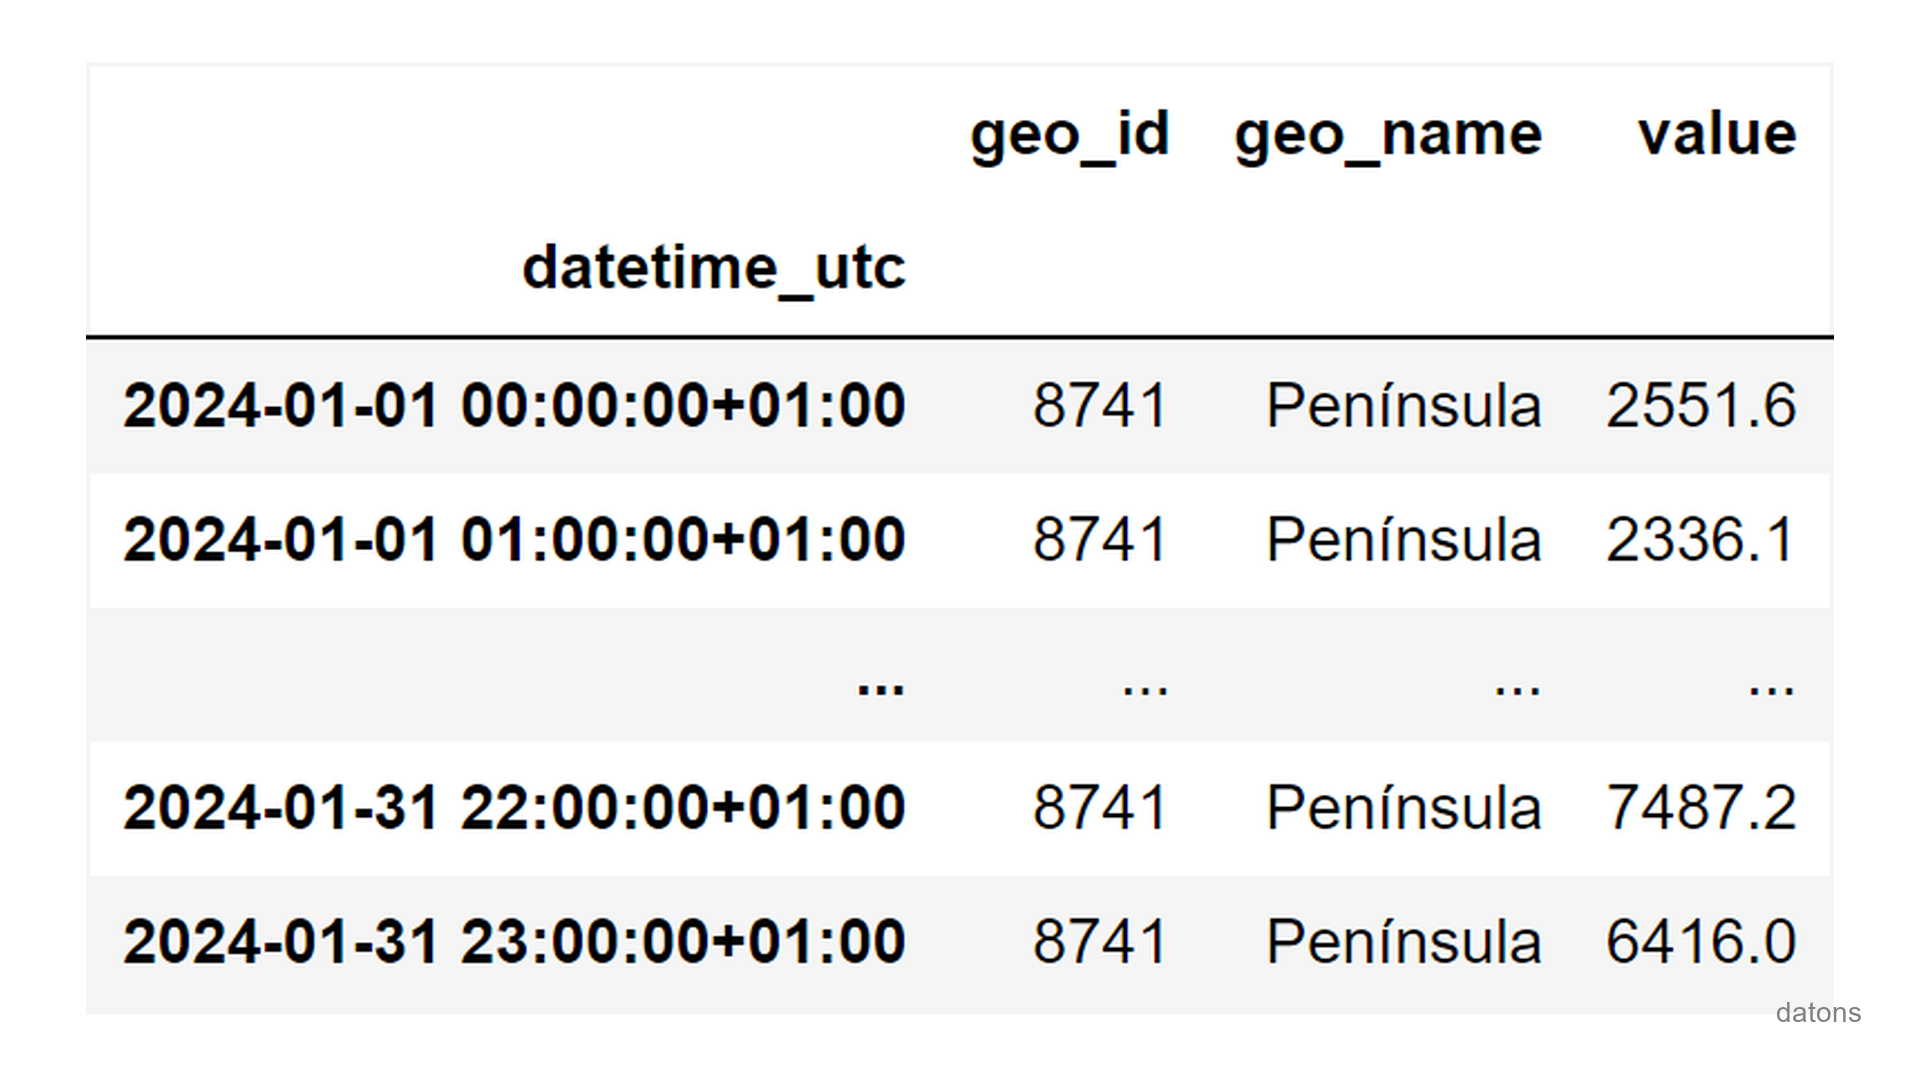
Having a month of information, we could visualize the total daily generation.
df.resample(rule='D').value.sum().plot(kind='bar');
Conclusions
Thanks to this tutorial, you’ve learned several important aspects about ESIOS, APIs, and Python:
- Token: You learned how to obtain a token to access the ESIOS API.
- Indicators: You identified and accessed specific indicators.
- Data Download: You managed to download data using Python.
- Table Construction: You created data tables from API responses, a key skill for organizing and preparing data for analysis.
- Visualization: You processed and visualized data to better interpret it.
- Date Range: You adjusted the date range for your specific needs.
Do you think this tutorial could be useful to a colleague? You know, sharing is caring.


