Every hour, the US power grid coordinates the electricity supply and demand. A lot of data is generated in the process.
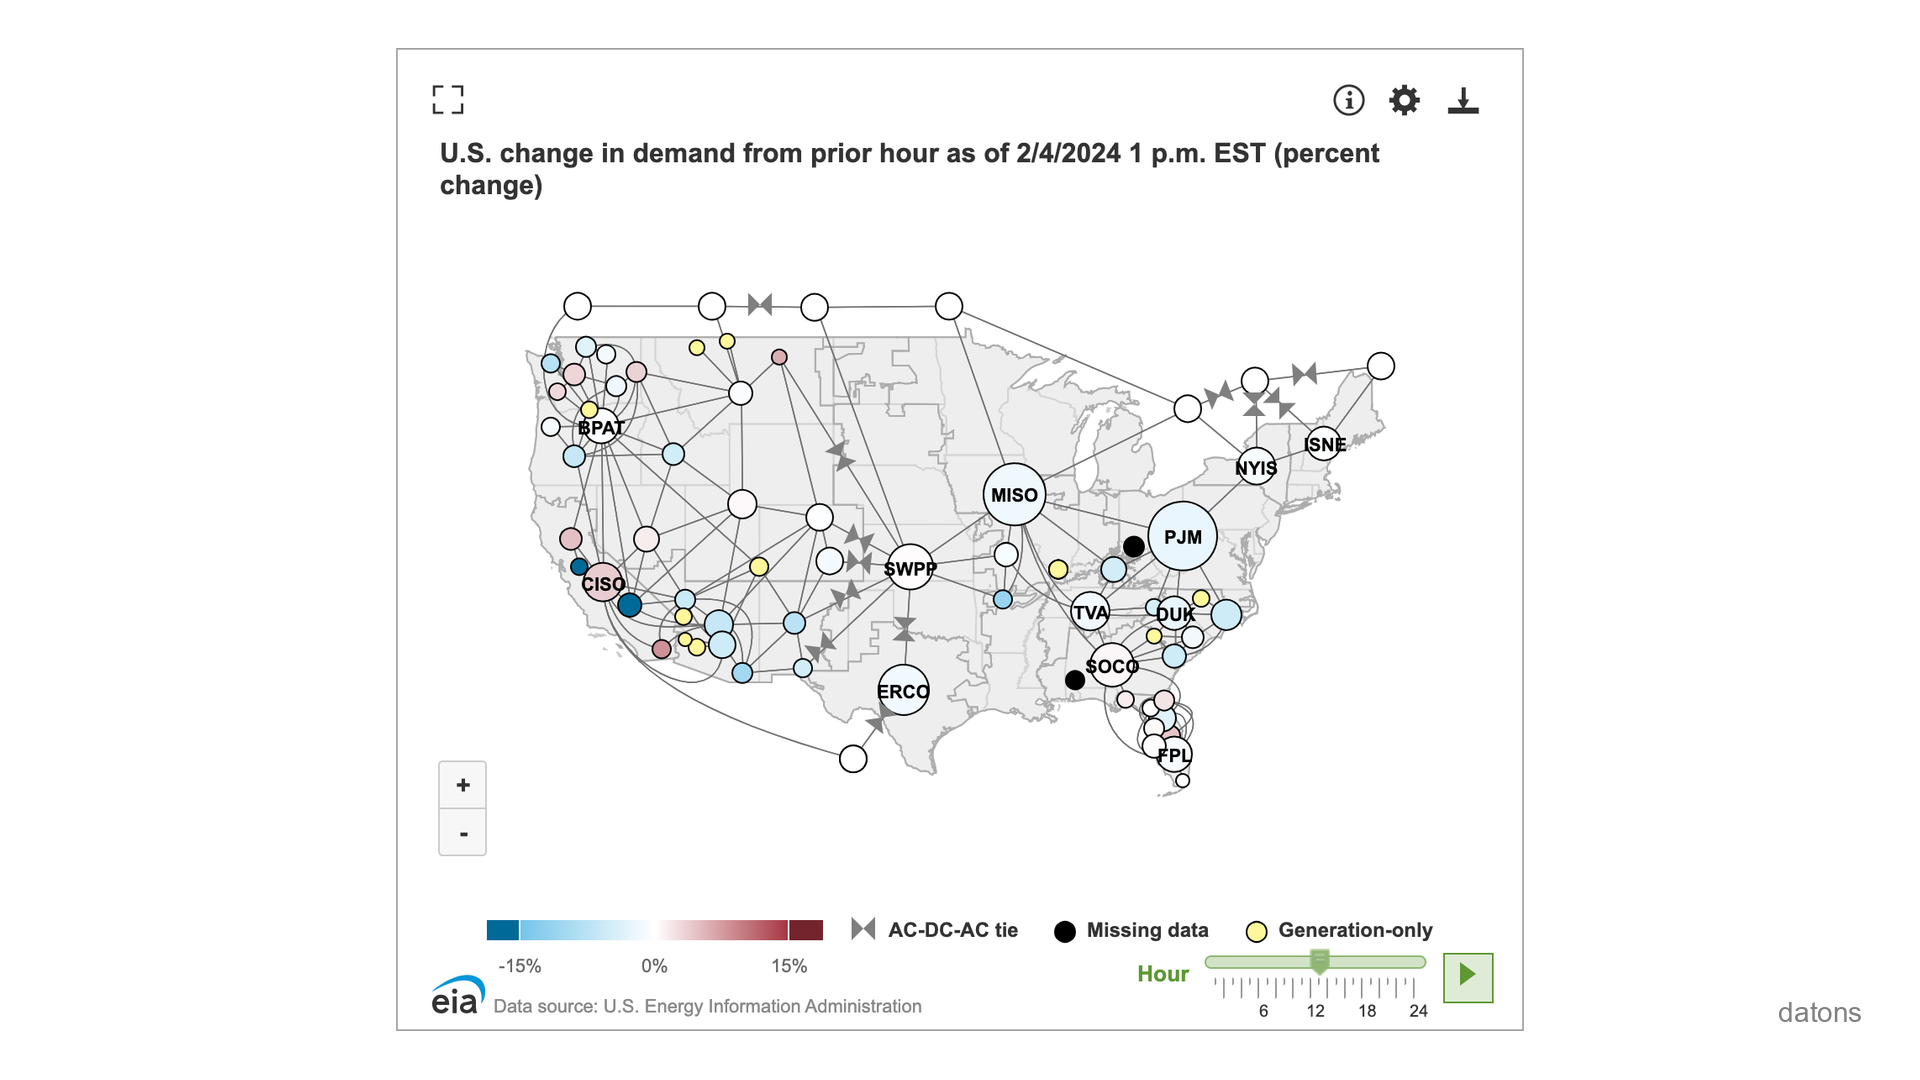
For example, the following chart represents the electricity demand by subregion.
Instead of downloading the Excel files manually, and clicking through the menus, you can automate the process using programming.
In this tutorial, you’ll learn how to use the EIA (Energy Information Administration) API with Python.
Questions
- How to identify indicators from EIA API?
- How to use EIA API to download data programmatically?
- How to build a table from API response data?
- How to overcome EIA API data limits?
- How to filter data from a specific period?
- How to export data into an Excel file?
Methodology
EIA API key
Register on the official EIA API website, to get the API key, which is necessary to request data.
API_KEY = 'YOUR_API_KEY'Data catalogs
The EIA API provides access to numerous data catalogs. The following code uses the API’s base URL to request the catalog’s list.
URL_BASE = "https://api.eia.gov/v2/"

import requests

res = requests.get(URL_BASE, params={'api_key': API_KEY})
data = res.json()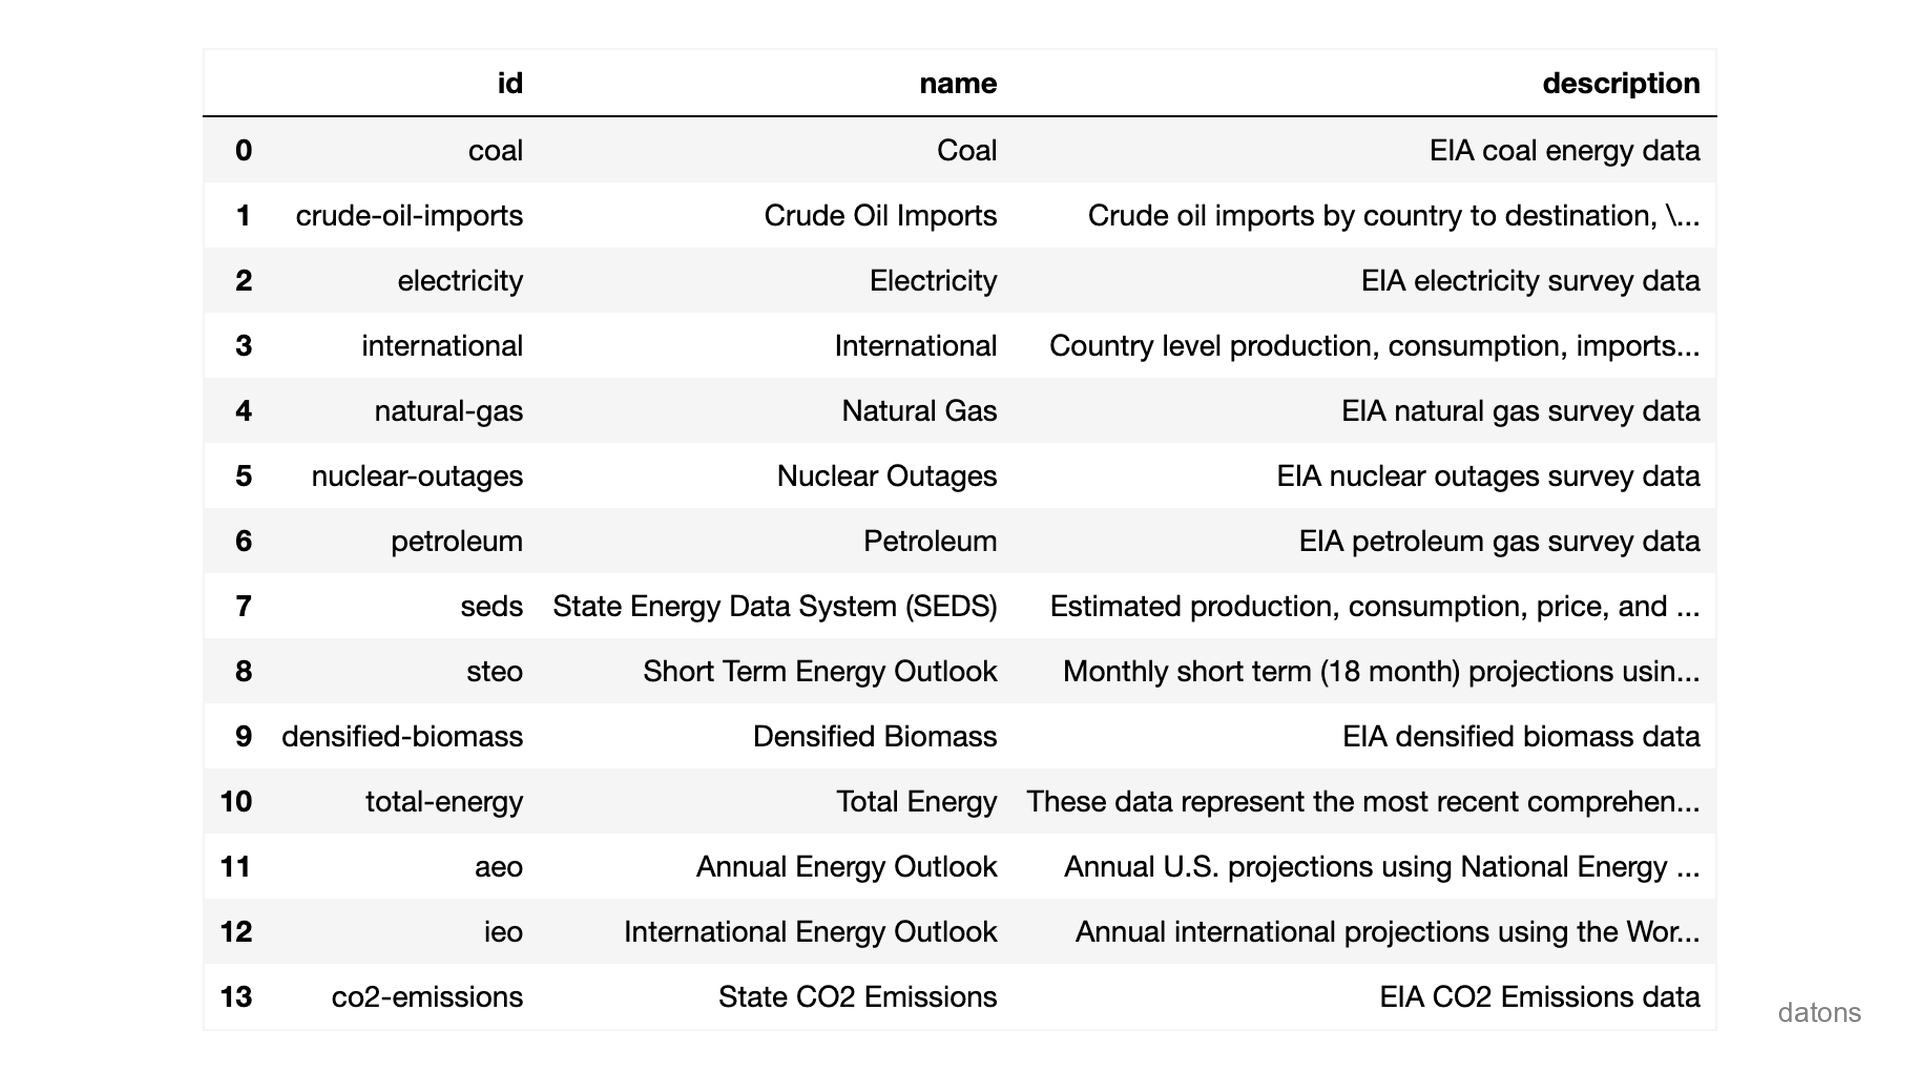
Nested categories
Since we are interested in the electricity demand, we’ll use the
electricity endpoint.
endpoint = 'electricity'
url = URL_BASE + endpoint

res = requests.get(url, params={'api_key': API_KEY})
data = res.json()
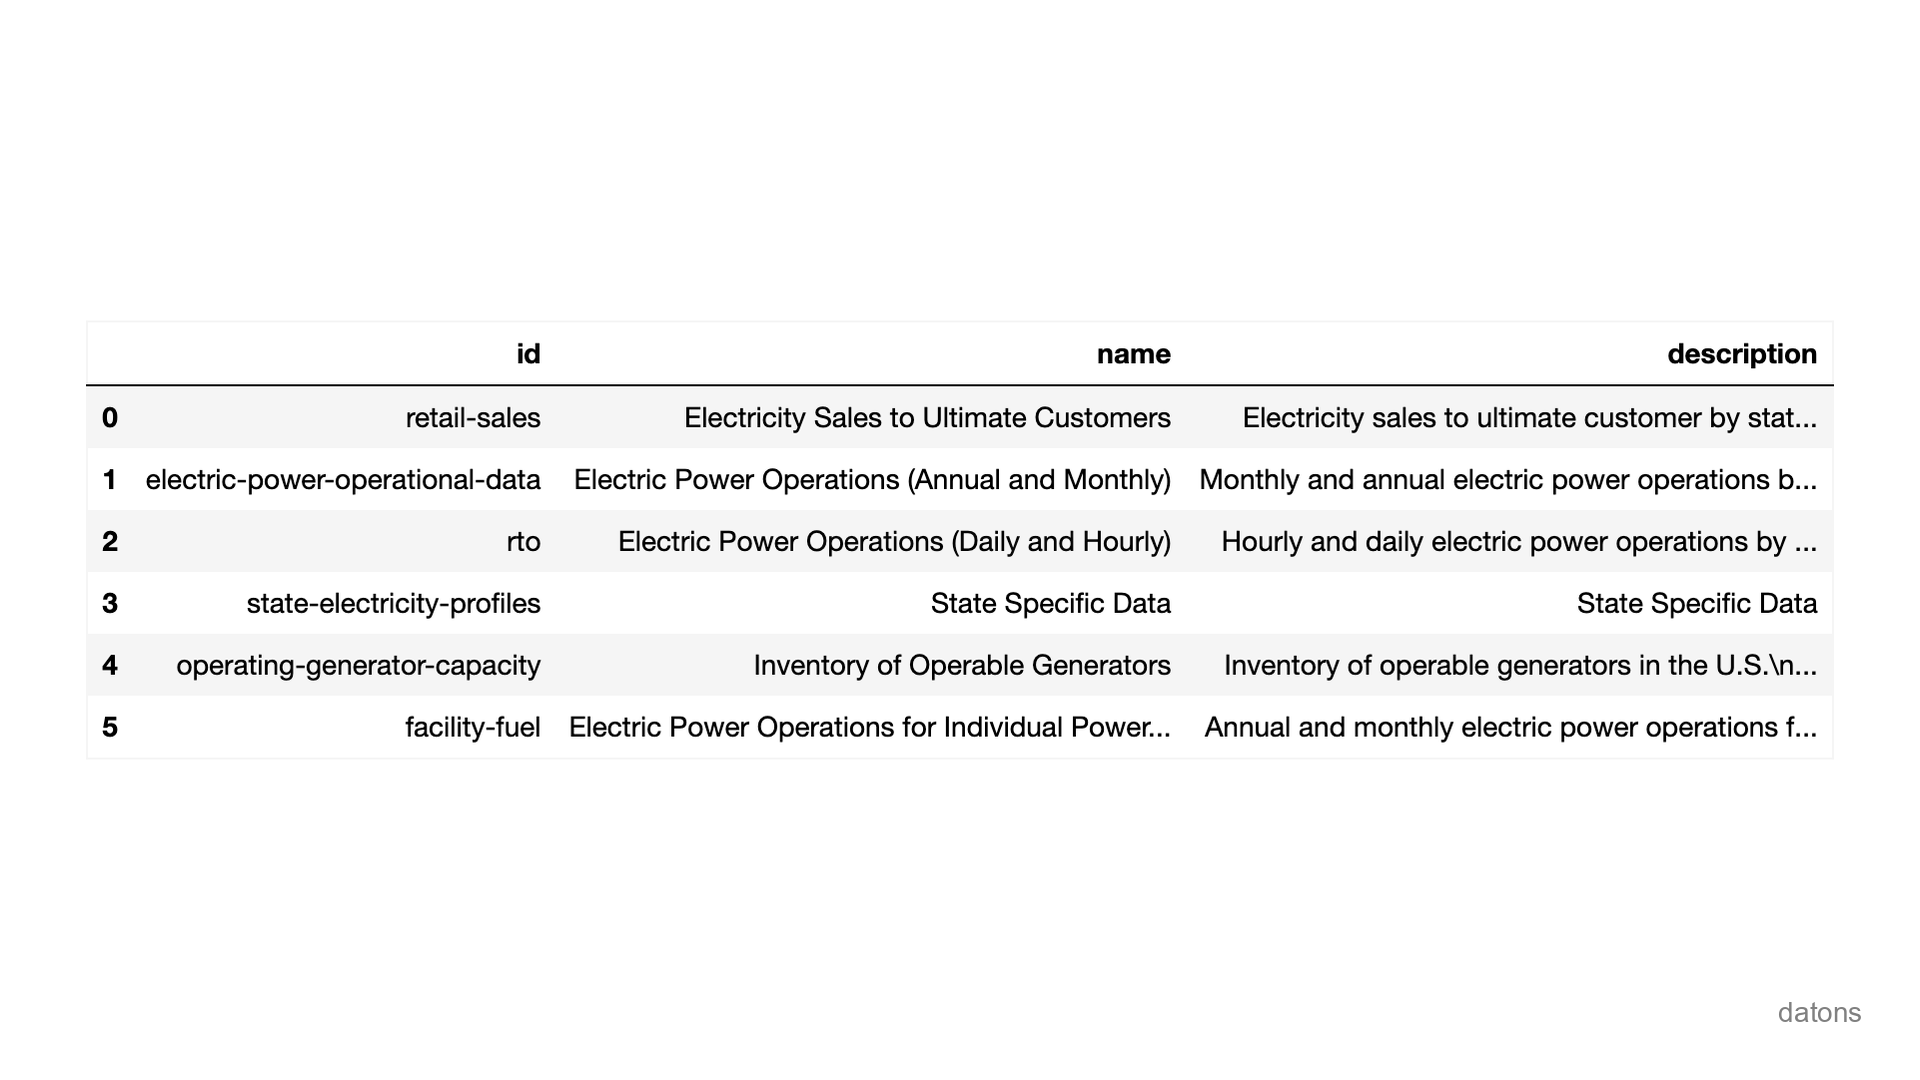
There are nested categories within each catalog.
The demand is available through the rto endpoint.
Request data from endpoint
Configure the endpoint
electricity/rto/daily-region-sub-ba-data to get the demand
by Balancing Authority subregion.
At the end of the URL, add data to download the data
instead of the endpoint information.
endpoint = 'electricity/rto/daily-region-sub-ba-data/'
url = URL_BASE + endpoint + 'data'

res = requests.get(url, params={'api_key': API_KEY})
data = res.json()
Build table from API response data
The response from the API is not represented in a tabular format. It
is a JSON object. Therefore, we need to transform
it into a table using the pandas library.
import pandas as pd

df = pd.DataFrame(data['response']['data'])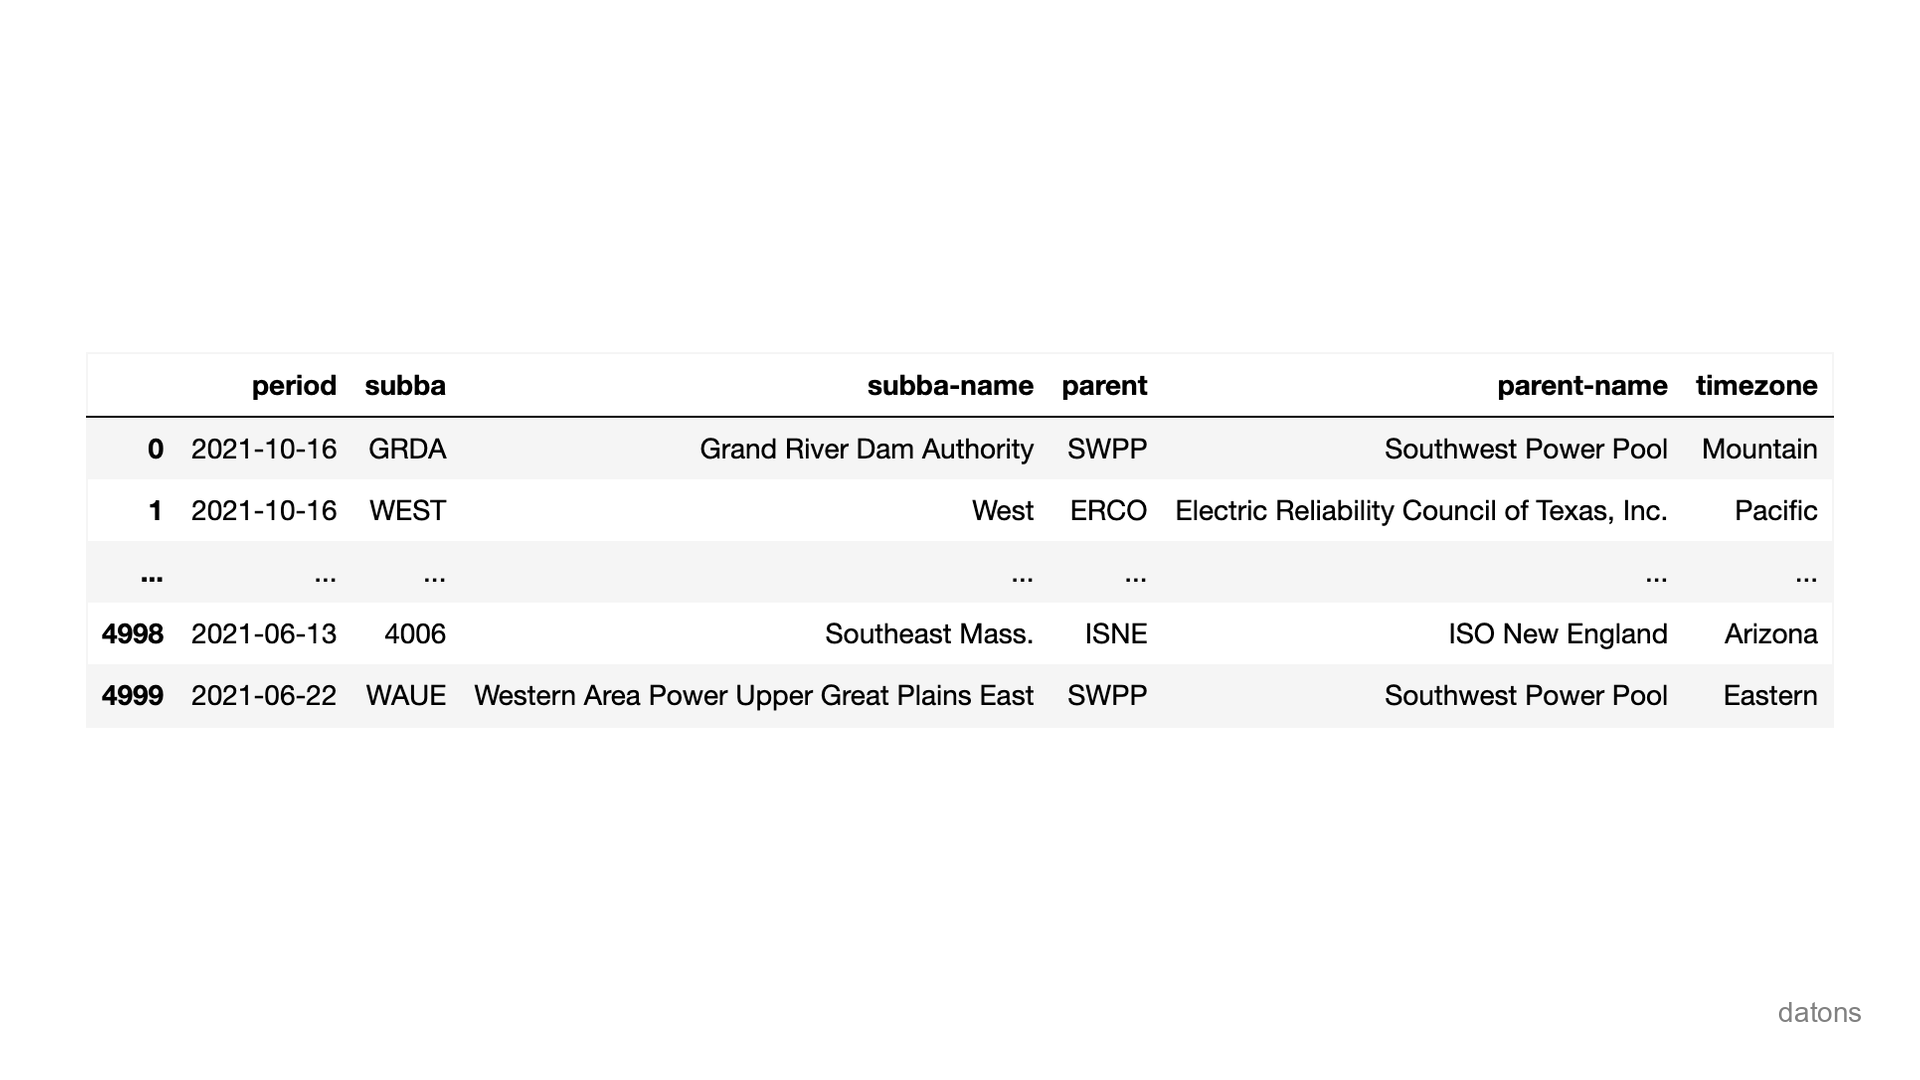
There is a problem with the limits of the data. The API returns only
the first 5,000 rows and the value of the electricity
demand doesn’t appear in the table.
How to fetch all the data until now with the values?
Fetching all data with values
Using the offset parameter, you can fetch the data in
chunks of 5,000 rows.
With the data[] parameter, you’ll get the values of the
electricity demand.
This process may take some time; you may sit comfortably ;)
parameters = {
    'api_key': API_KEY,
    'offset': 0,
    'data[]': 'value'
}

data_all = []

while True:
    res = requests.get(url, params=parameters)
    data = res.json()
    data_all.extend(data['response']['data'])

    if len(data['response']['data']) < 5000:
        break

    parameters['offset'] += 5000

df = pd.DataFrame(data_all)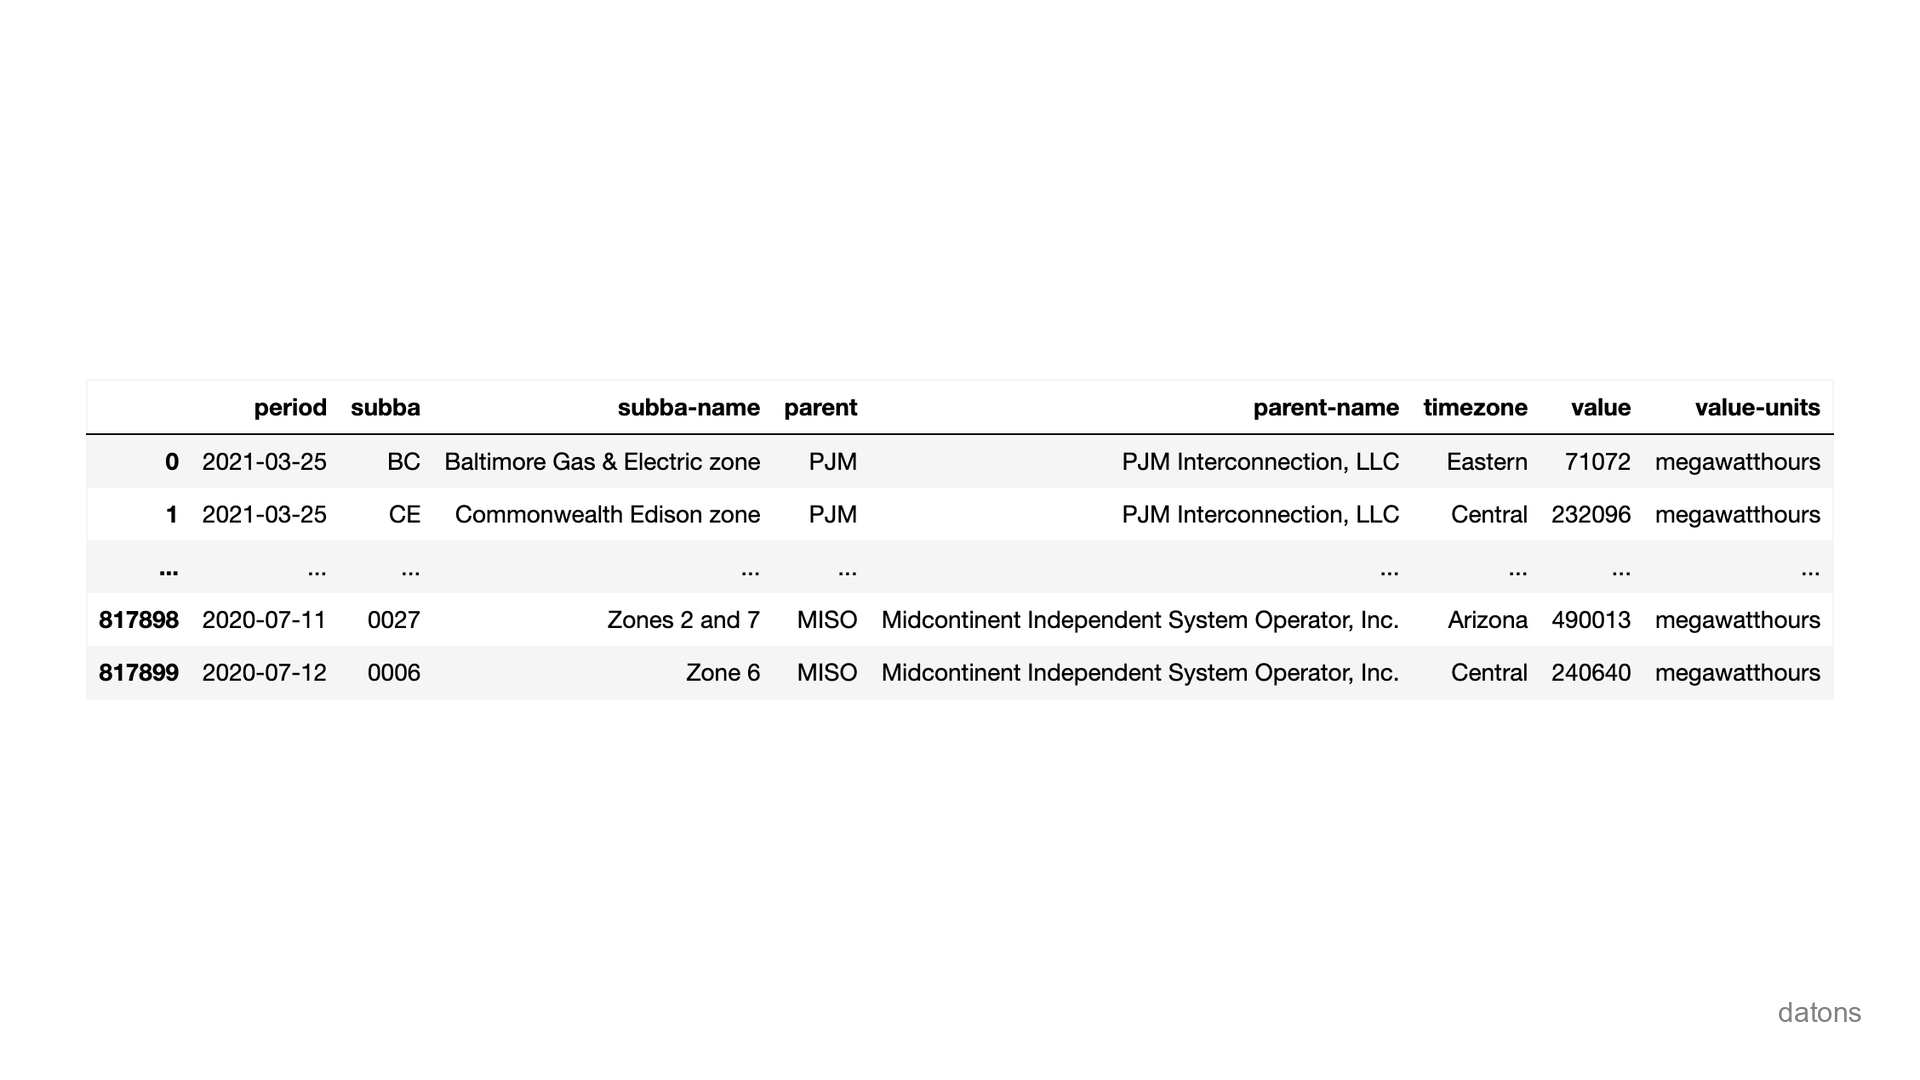
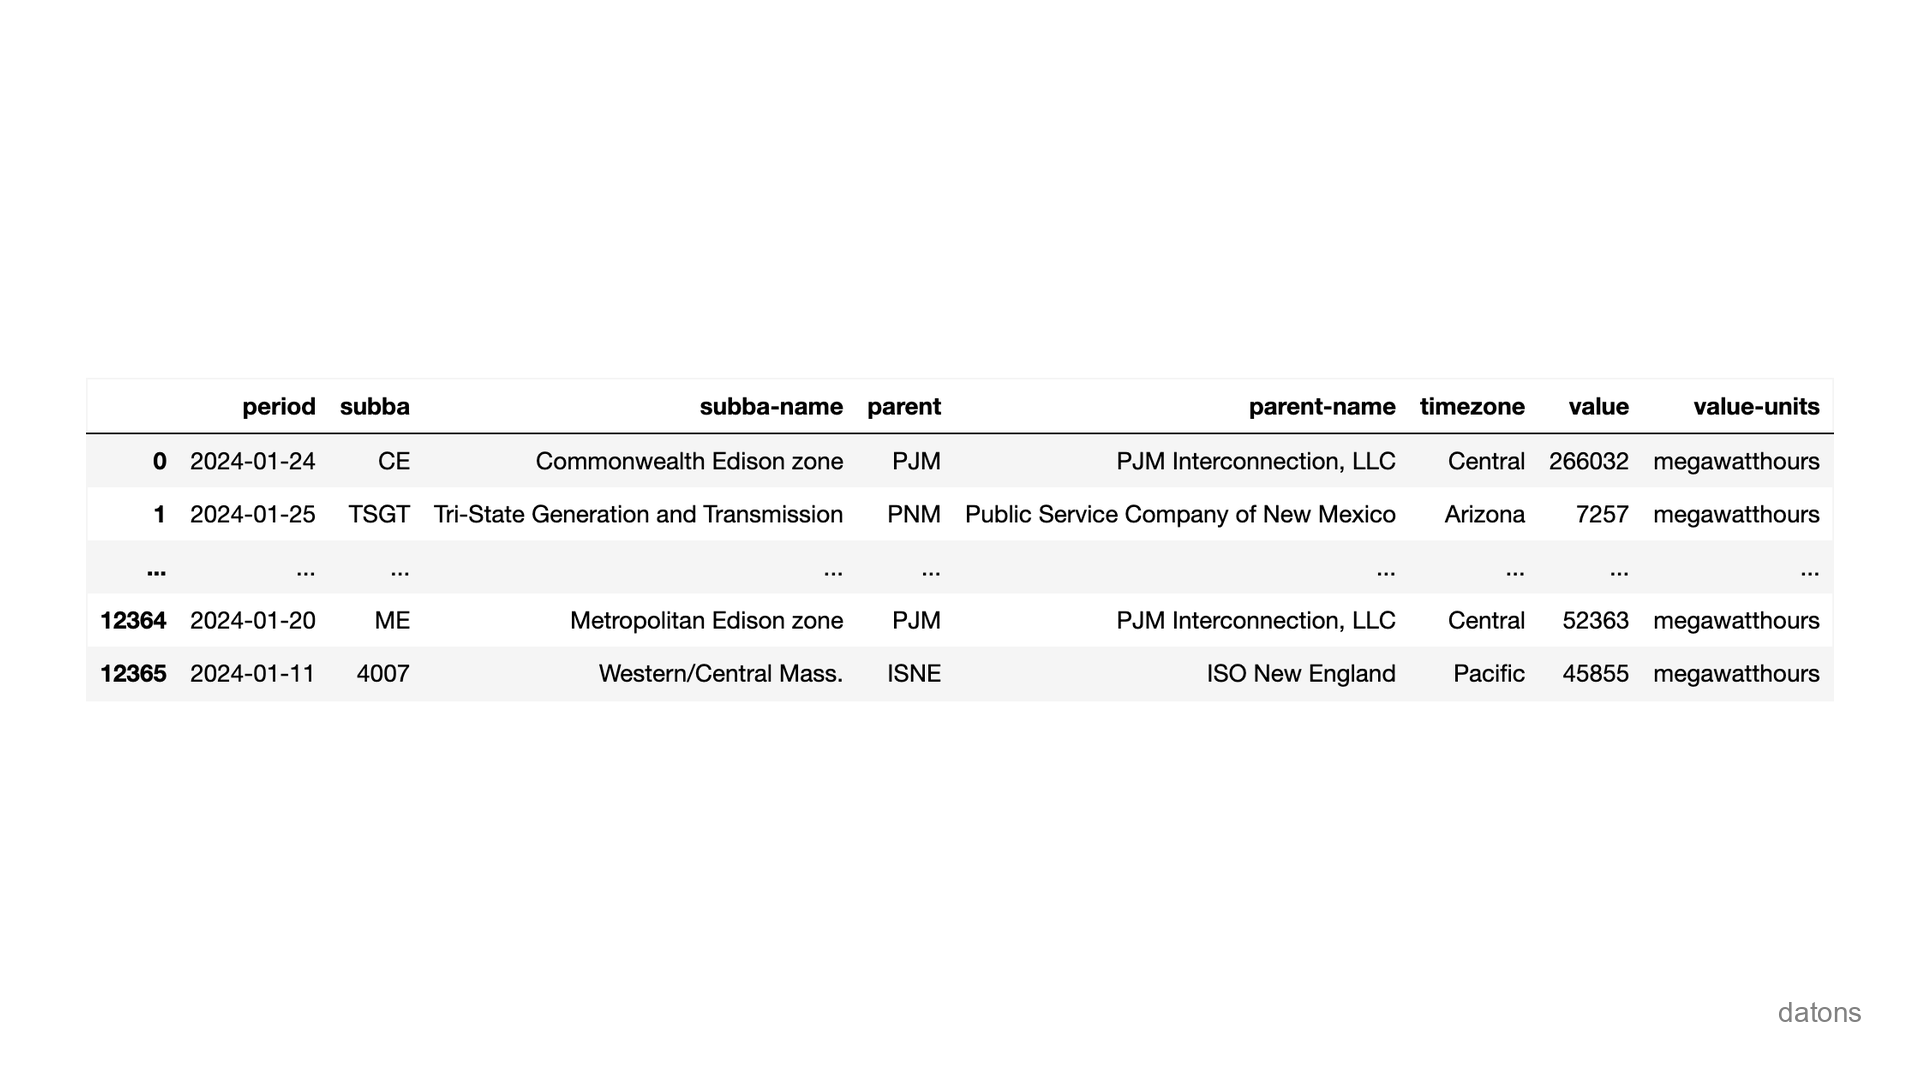
What if you’d like to download the data from a specific period?
Filter data from specific period
For example, to filter the data from 2024, you can use the
start parameter to specify the initial date.
parameters = {
    'api_key': API_KEY,
    'offset': 0,
    'data[]': 'value',
    'start': '2024-01-01'
}
Export data table to Excel
Finally, you can export the data to an Excel file to analyze it there.
Although, you might want to save time analyzing the data directly in Python ;)
df.to_excel('us-energy-demand.xlsx')Conclusions
Now, instead of manually downloading EIA data and navigating through menus, you know how to automate the process using Python.
In this tutorial, you’ve learned how to:
- Identify indicators from EIA API.
- Use EIA API to download data programmatically.
- Build a table from API response data.
- Overcome EIA API data limits.
- Filter data from a specific period.
- Export data into an Excel file.


