When comparing Spain ES with Italy
IT_SACO_AC, we observe that the increase in the hourly
price of electricity in Spain takes longer to arrive.
One of the reasons is that solar generation reduces the price of electricity.
Although both countries are in the same time zone, Italy is further east than Spain, so the sun sets earlier in Italy than in Spain.
In this tutorial, we’ll explain how to download European energy data through the ENTSO-E API and analyze it with Python.
Questions
- How to access the ENTSO-E API to download European energy data?
- Which function is used to download generation data?
- And electricity prices?
- How to use area codes to download data by country?
- How are data grouped to perform hourly comparisons?
- How to download multiple market areas at once?
Methodology
Getting access token
To programmatically download data from ENTSO-E, you need an access token.
Following the steps in the official documentation, you register on the ENTSO-E page, and subsequently, you will need to send them an email at transparency@entsoe.eu with the subject “Restful API access”.
API_TOKEN = 'YOUR_TOKEN'To work with the ENTSO-E API in Python, it’s very easy thanks to the
open-source
entsoe library, which has integrated the most common
endpoints of the API.
There are two ways to work with this library:
EntsoePandasClientdownloads and preprocesses the data inDataFrameformat to analyze it withpandasmore comfortably.EntsoeRawClientreturns the data in raw format, in XML.
To get straight to the point, we’ll work with
EntsoePandasClient.
from entsoe import EntsoePandasClient

client = EntsoePandasClient(api_key=API_TOKEN)
Downloading generation by technology in Italy
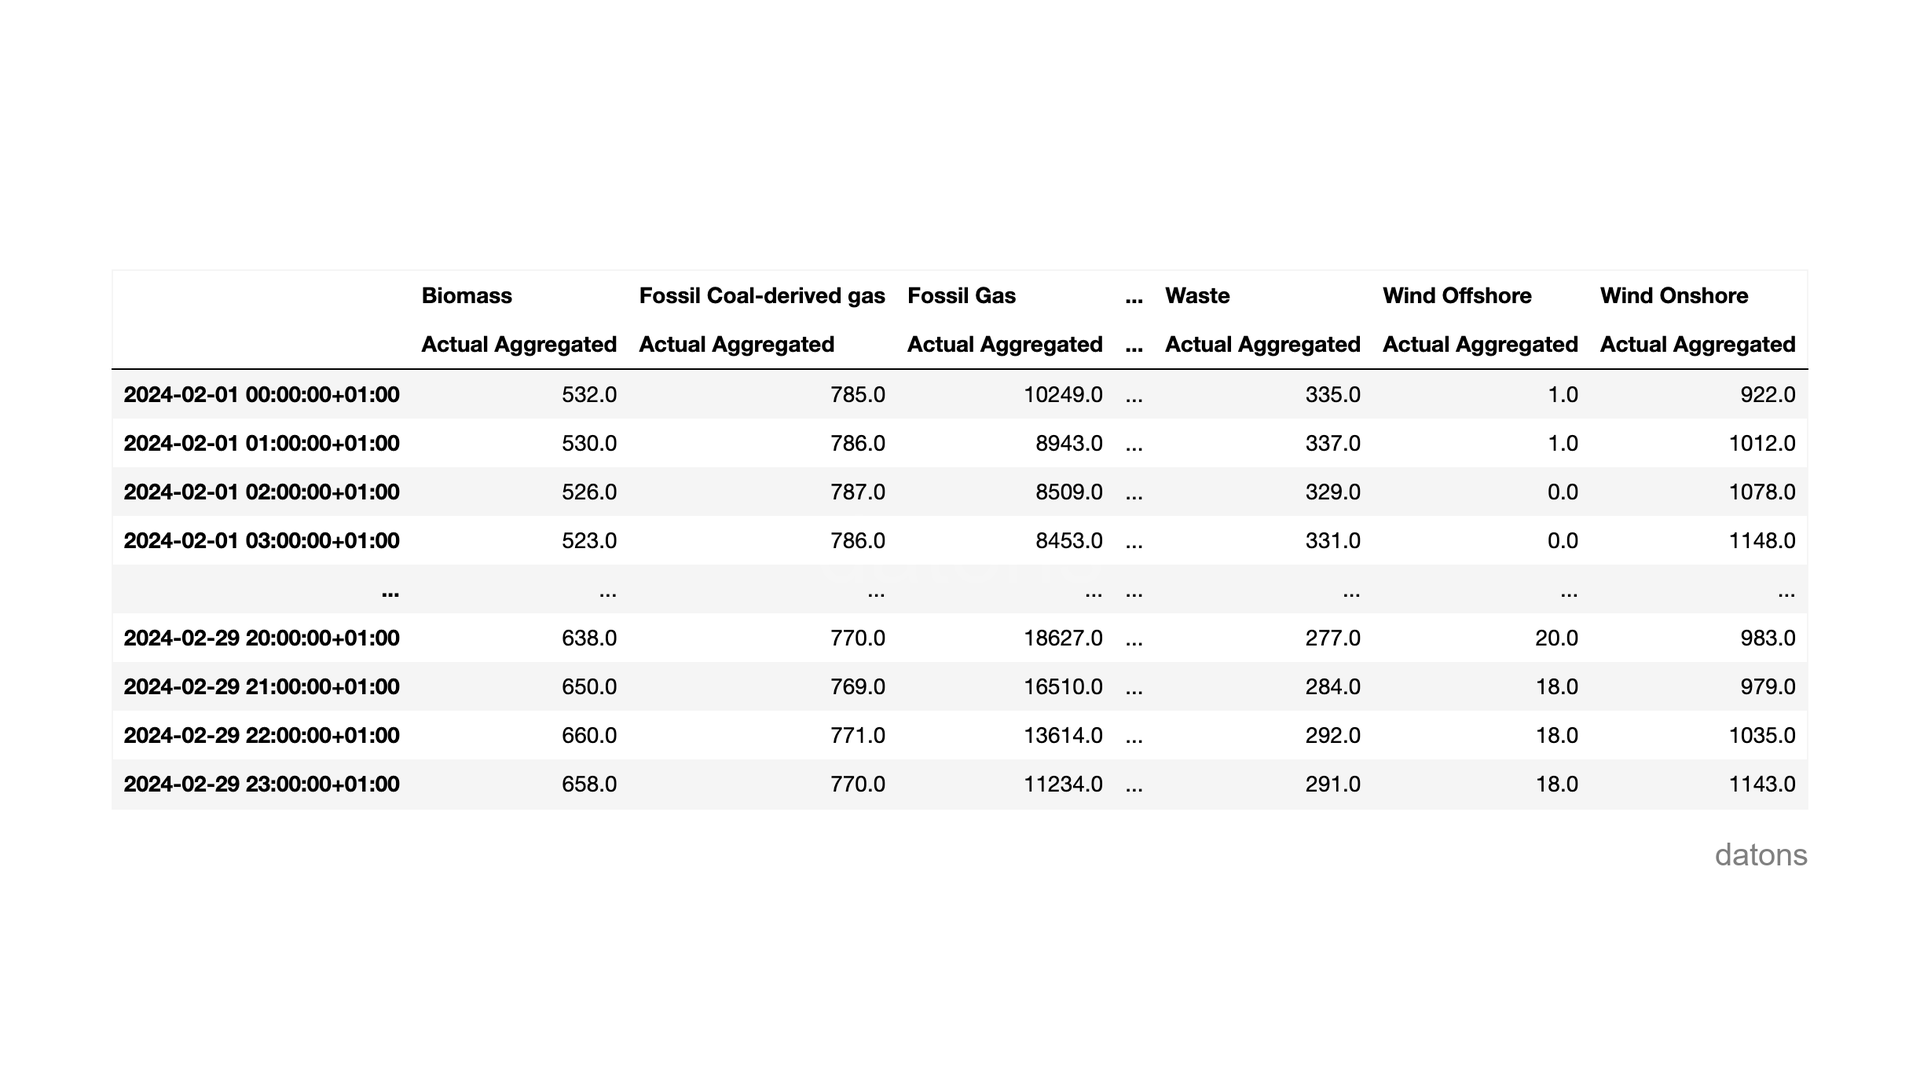
To get started, we’re going to download the data on generation by technology in Italy during February 2024.
import pandas as pd

start = pd.Timestamp('20240201', tz='Europe/Rome')
end = pd.Timestamp('20240229T2359', tz='Europe/Rome')

df = client.query_generation(
    country_code='IT',
    start=start, end=end
)
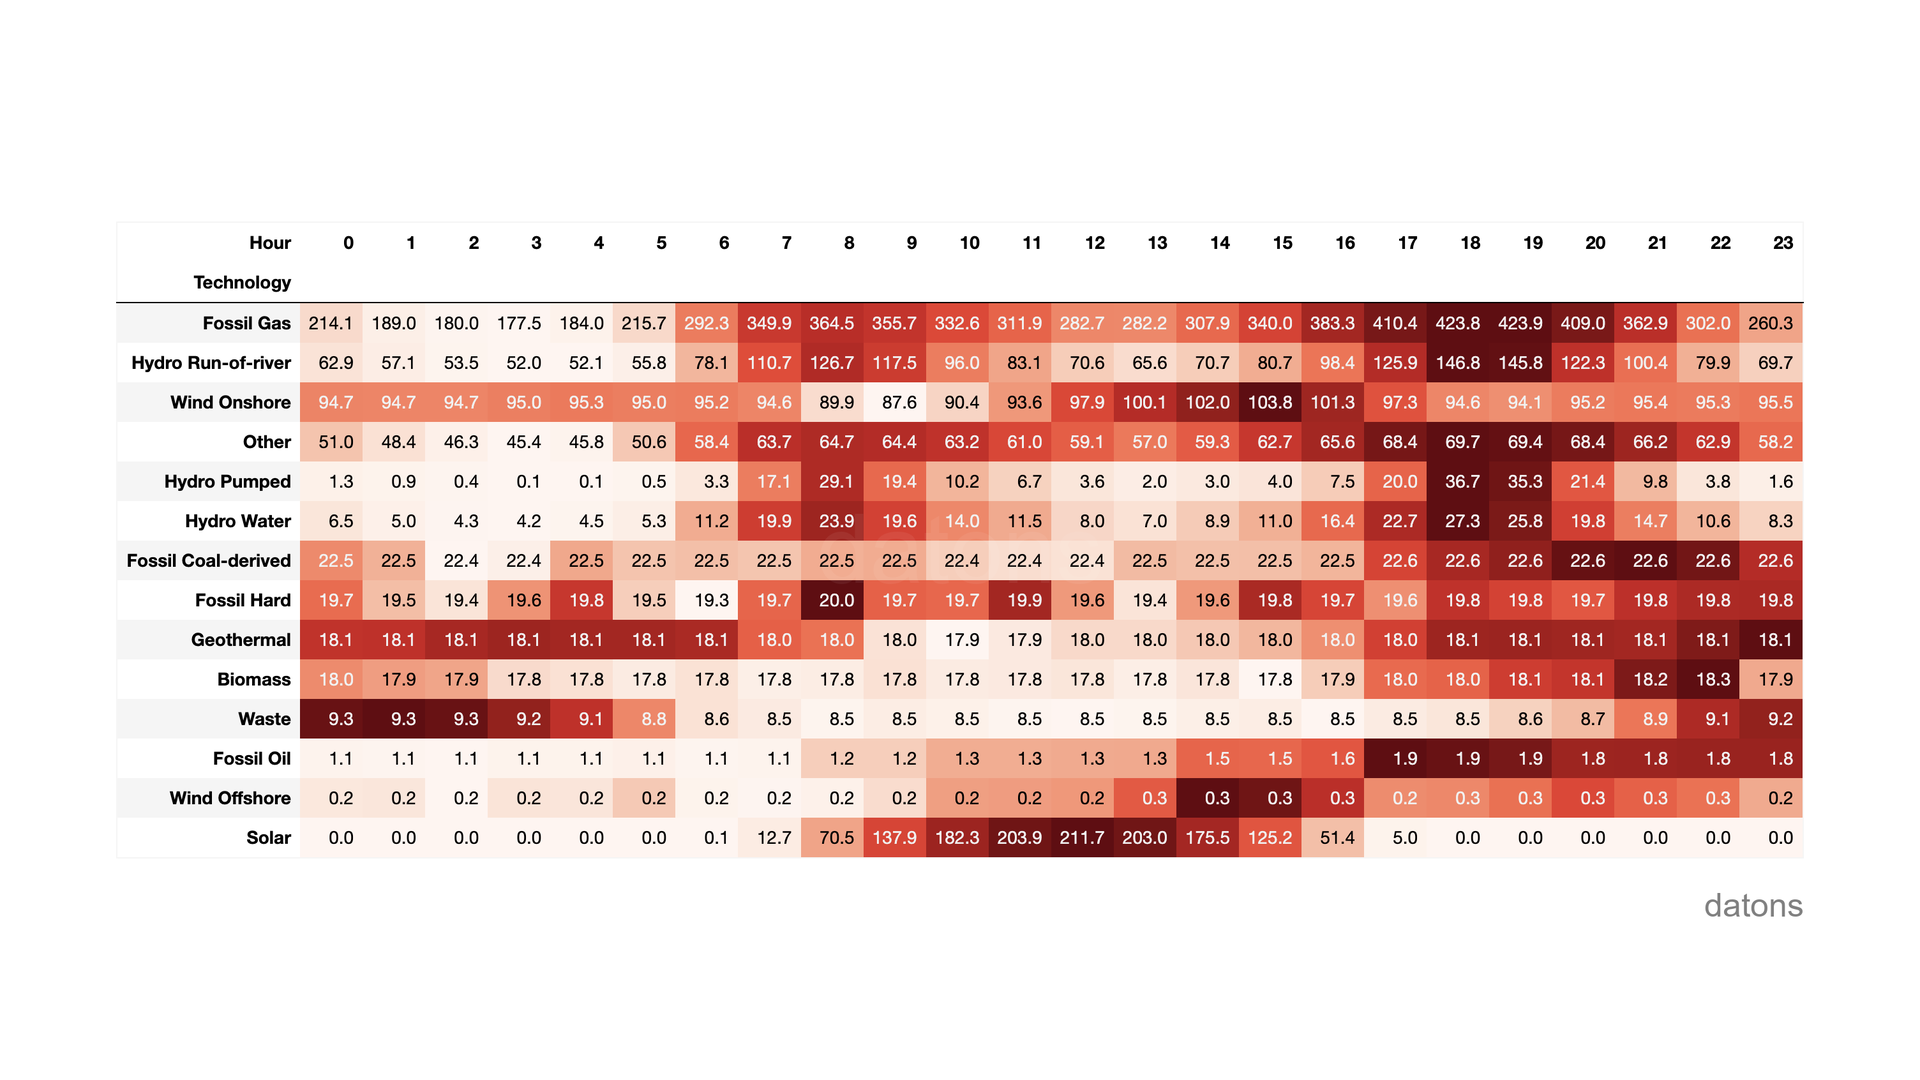
Hourly comparison of generation by technology
As usual, we’re going to create a heat matrix to highlight the differences in generation by technology in Italy according to the time of day.
df['hour'] = df.index.hour
df.groupby(['hour']).sum()
Given that there are not many hours of sunlight in February, solar generation was only significant for a few hours, from 9 to 15.
Downloading electricity prices by area in Europe
We’re going to level up: we’ll download the electricity prices by area in Europe.
For this, we need the country codes that the entsoe
library uses to identify market areas.
areas = [
    'AT', 'BE', 'BG', 'HR', 'CZ', 'DE_LU', 'DK_1',
    'EE', 'FI', 'MK', 'FR', 'GR', 'HU', 'IE_SEM',
    'IT_SACO_AC', 'LV', 'LT', 'LU_BZN', 'ME', 'NL', 'NO_1',
    'PL', 'PT', 'RO', 'SE_1', 'RS', 'SK', 'SI',
    'ES', 'CH', 'UA_IPS'
]
We iterate over each area to download the prices for February 2024 and accumulate them in a list.
ls = []
for area in areas:
    s = client.query_day_ahead_prices(
        country_code=area,
        start=start, end=end
    )
    s.name = area
    ls.append(s)
Finally, we concatenate the list into a DataFrame where
each column represents a market area.
df = pd.concat(ls, axis=1)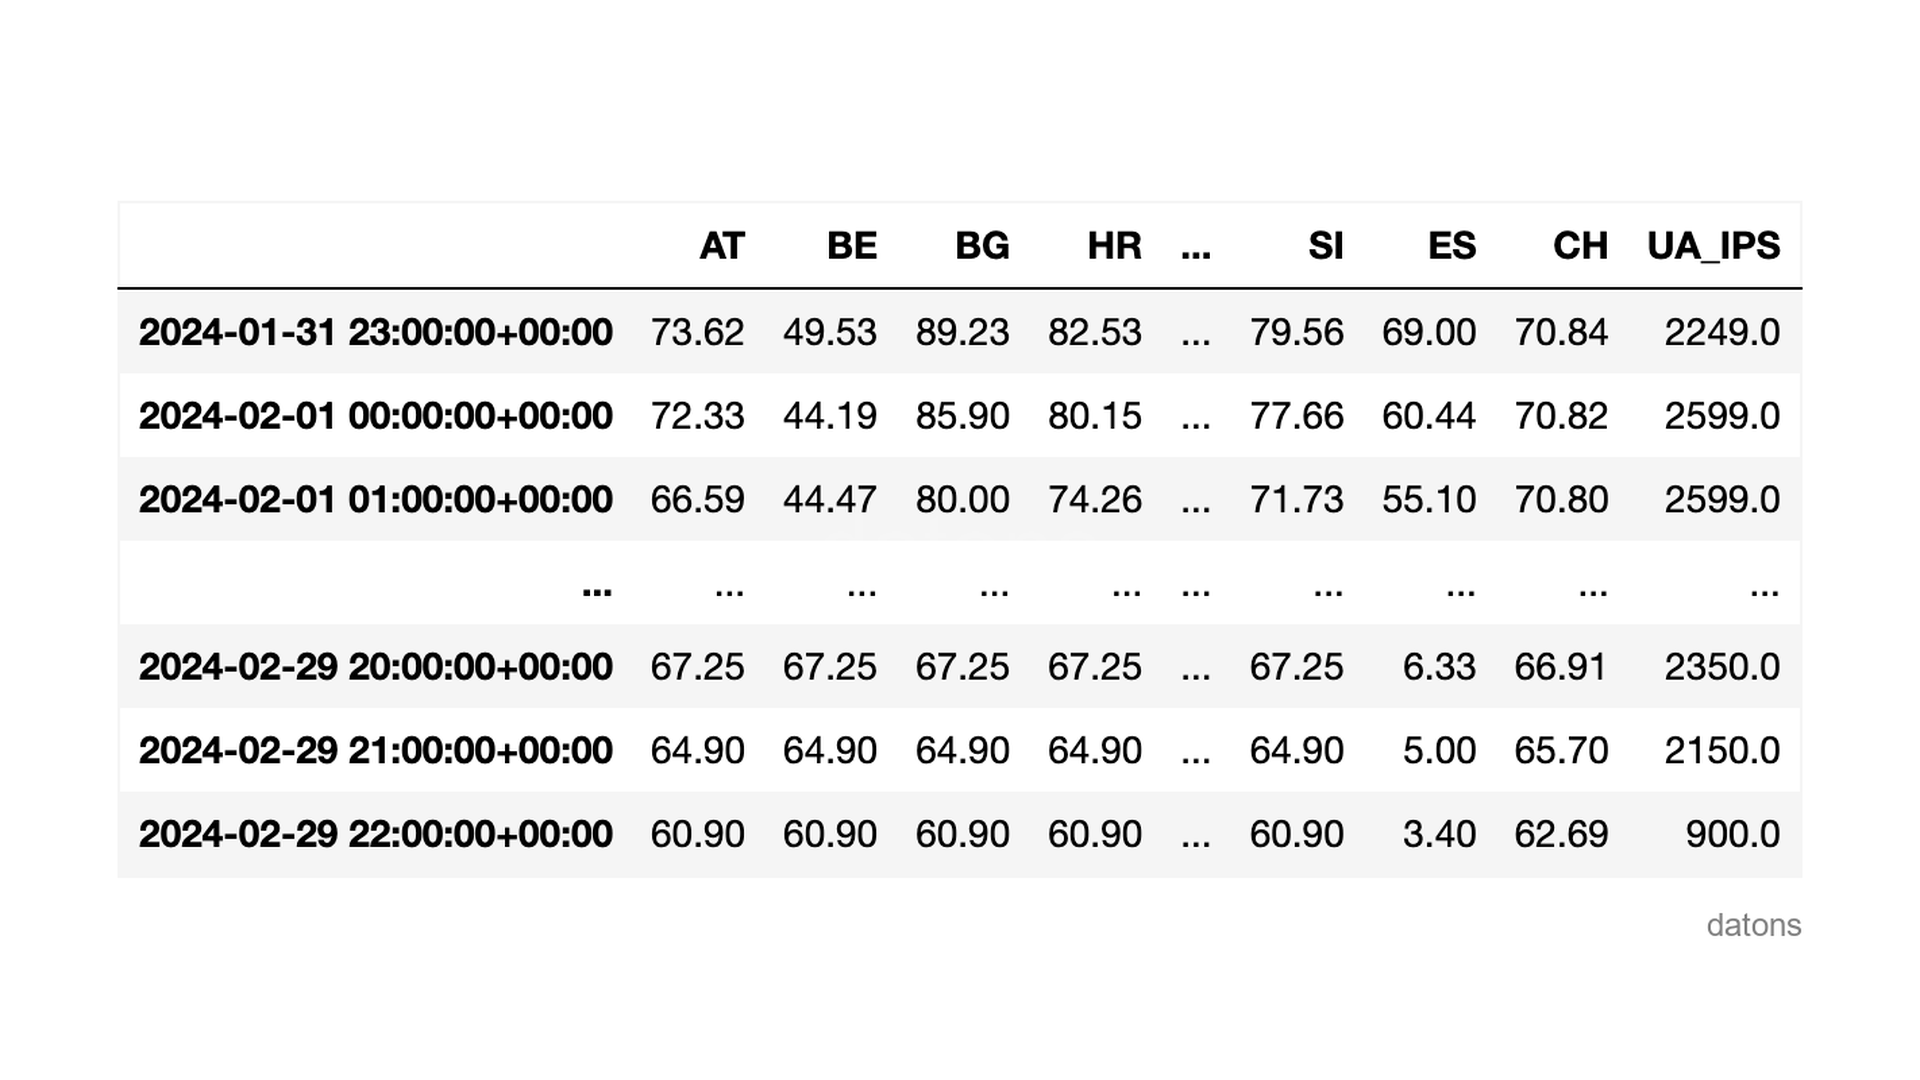
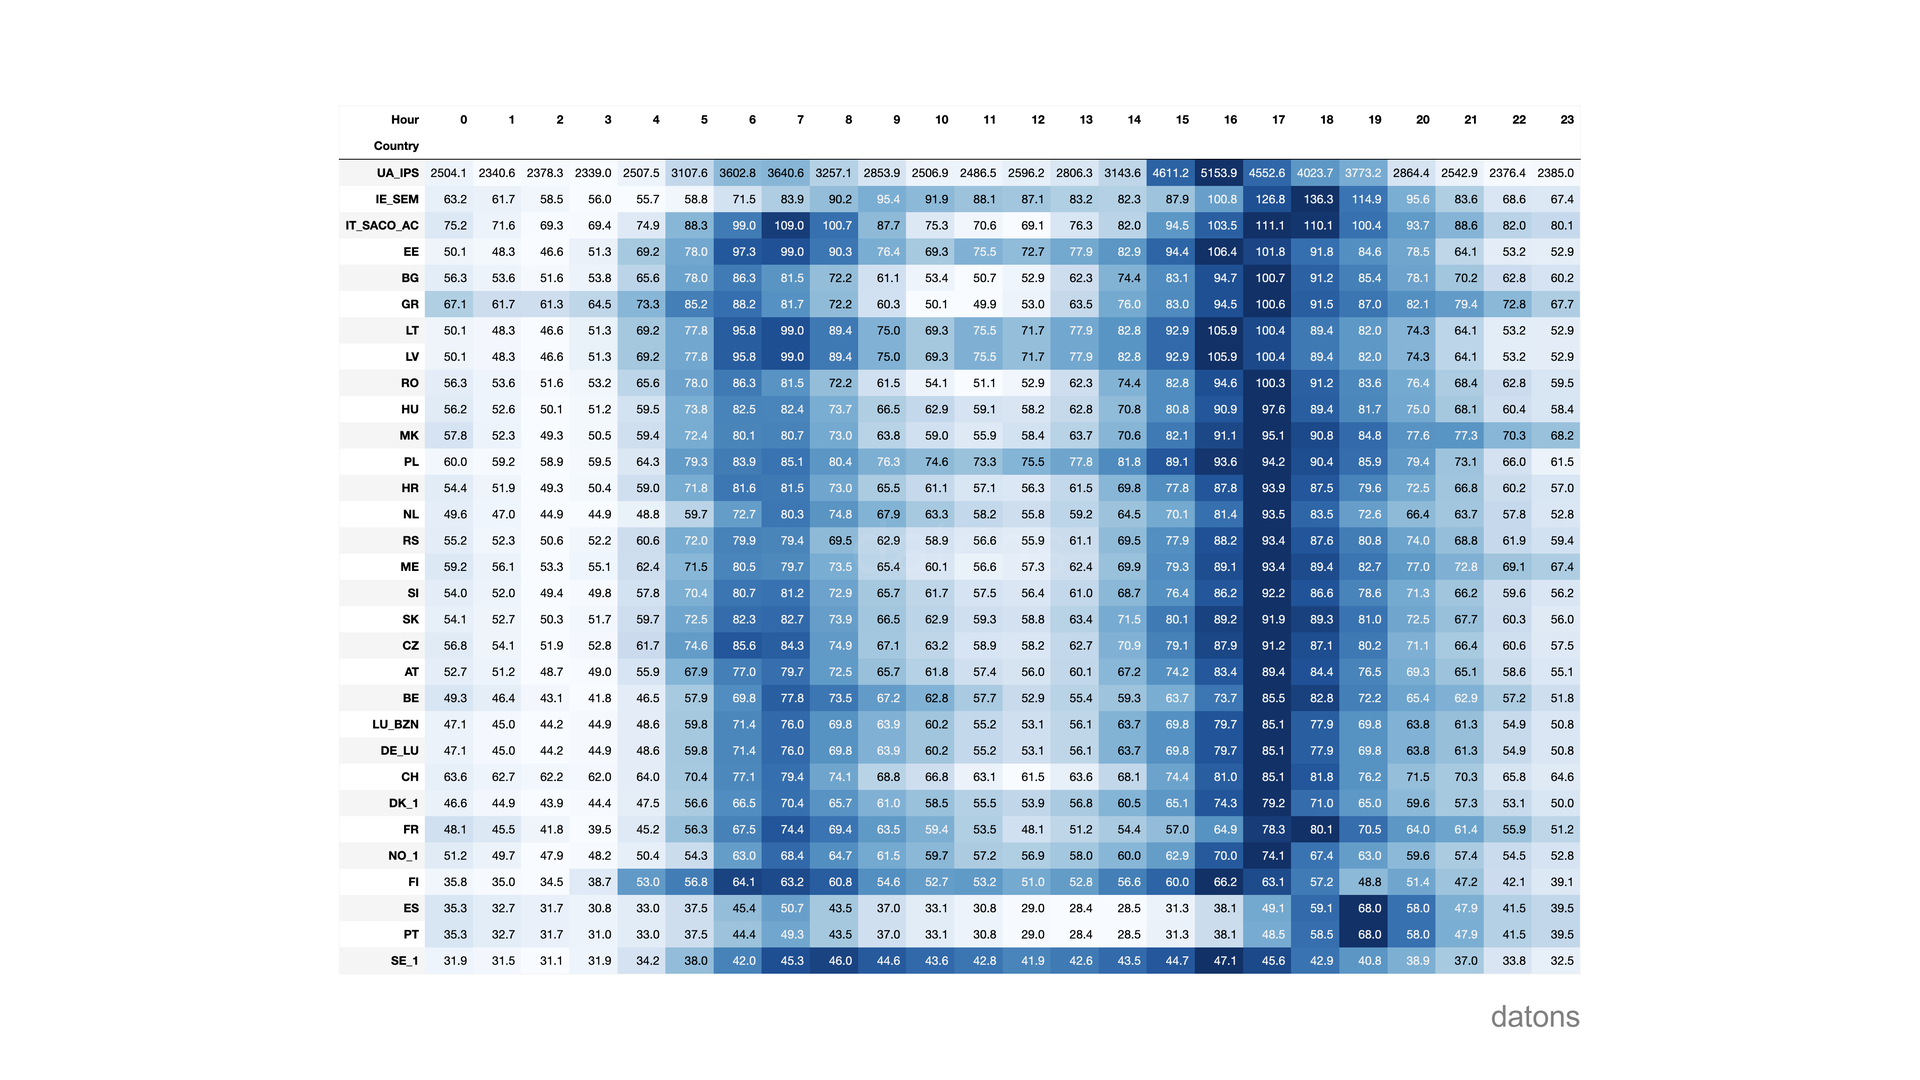
Hourly comparison of electricity prices
For the price, we calculate the average per hour, which is more representative than the sum (which we had used for generation).
df['hour'] = df.index.hour
df.groupby(['hour']).mean()
Notice how the price of electricity moves its most expensive range as the sun sets and demand increases, depending on the country.
When comparing Spain ES with Italy
IT_SACO_AC, we observe that the price increase in Spain
takes longer to arrive because, having the same time zone, Spain is
further west.
Conclusions
- Accessing the ENTSO-E API:
EntsoePandasClientis the client that, with the access token, allows us to download data and comfortably analyze it withpandas. - Downloading generation data:
client.query_generationto download energy generation data by technology from a specific country. - Downloading electricity prices:
client.query_day_ahead_pricesto get electricity prices for a specific market area. - Using area codes for country data:
country_codeto specify the market area from which we want to download the data. - Grouping data for hourly comparisons:
df.index.hourto get the hour anddf.groupbyto aggregate the values for each hour applying a mathematical function. - Downloading multiple market areas:
pd.concatto concatenate multiple indicators downloaded after iterating over a list of area codes.


