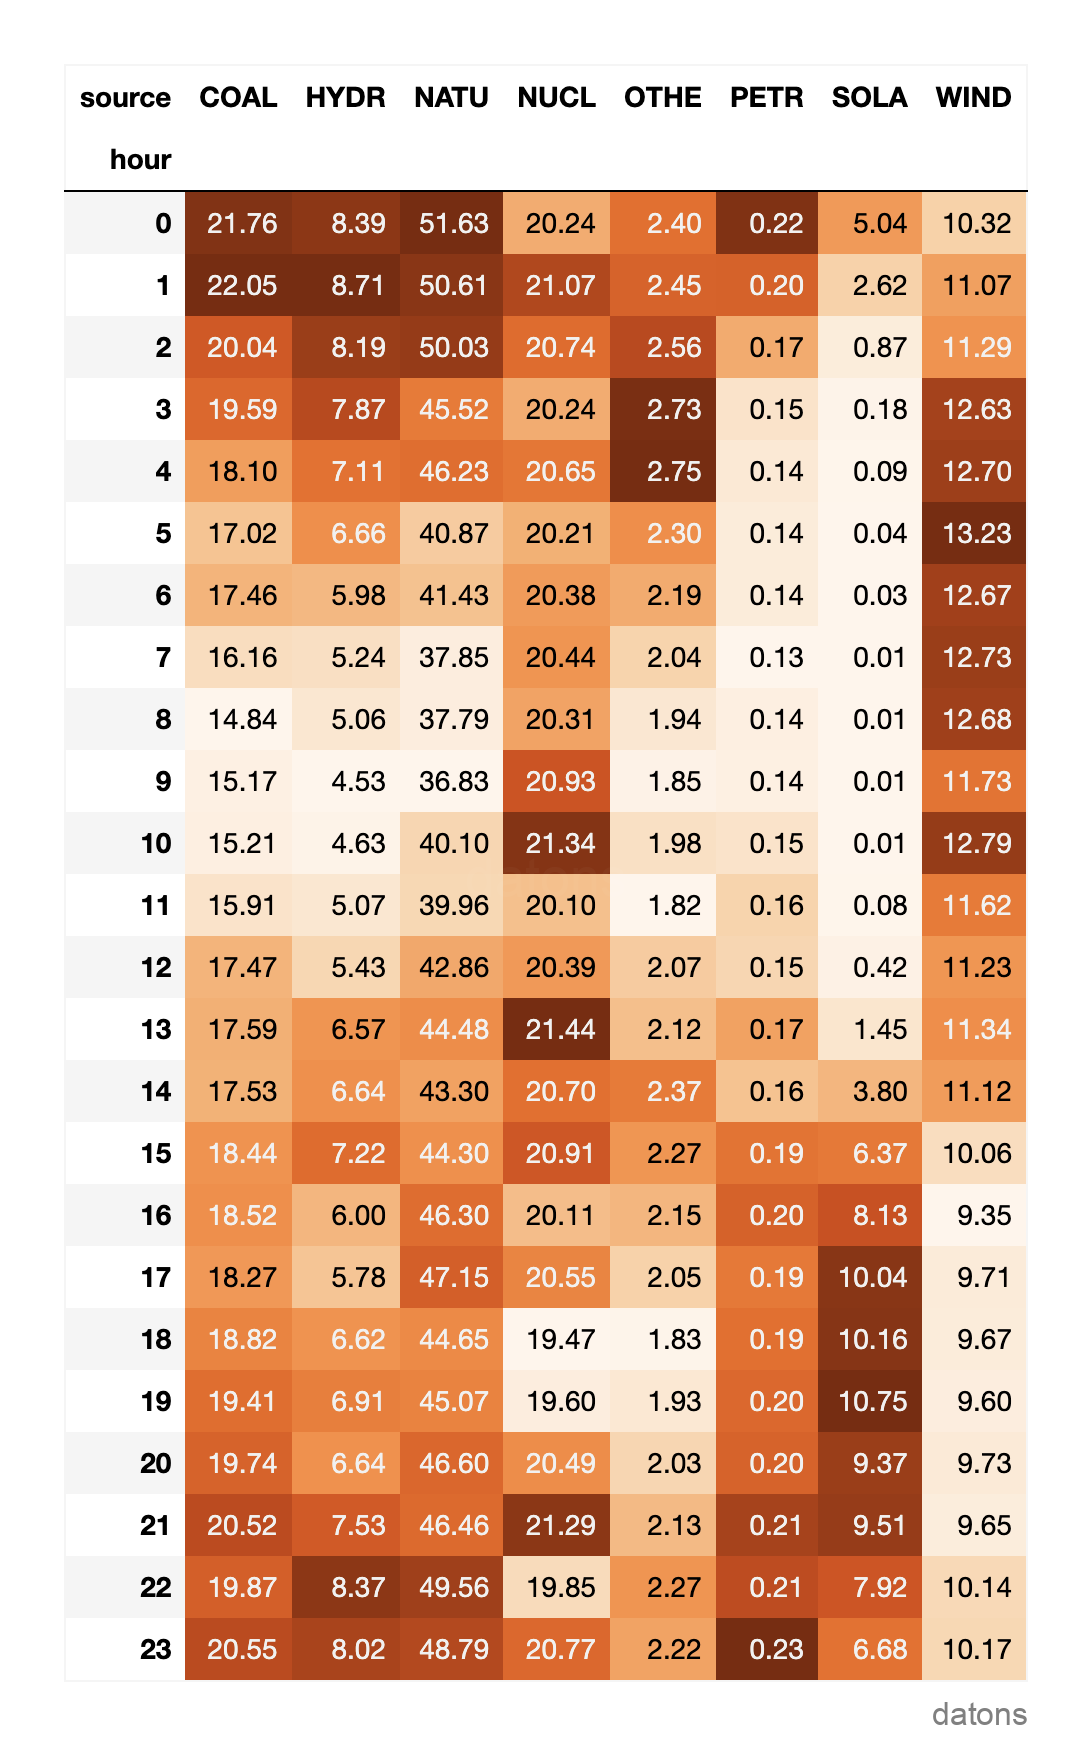
The following table represents a heat matrix that highlights the total amount of electricity, in terawatt-hours (TWh), produced by each source within the US48 power grid during 2023.
To create the heat matrix from the raw dataset, which typically comes in a long format, we need to apply several steps that will be covered in this tutorial.
Before we begin, let’s understand the dataset we are working with.
Data
The US power grid produces electricity from various sources, such as natural gas, solar, and petroleum, every hour. The amount of electricity produced by each source is recorded in each row of the dataset.
The data is provided by the US Energy Information Administration (EIA). Check out this tutorial to learn how to retrieve the data from the EIA API.
import pandas as pd
df = pd.read_csv('data.csv')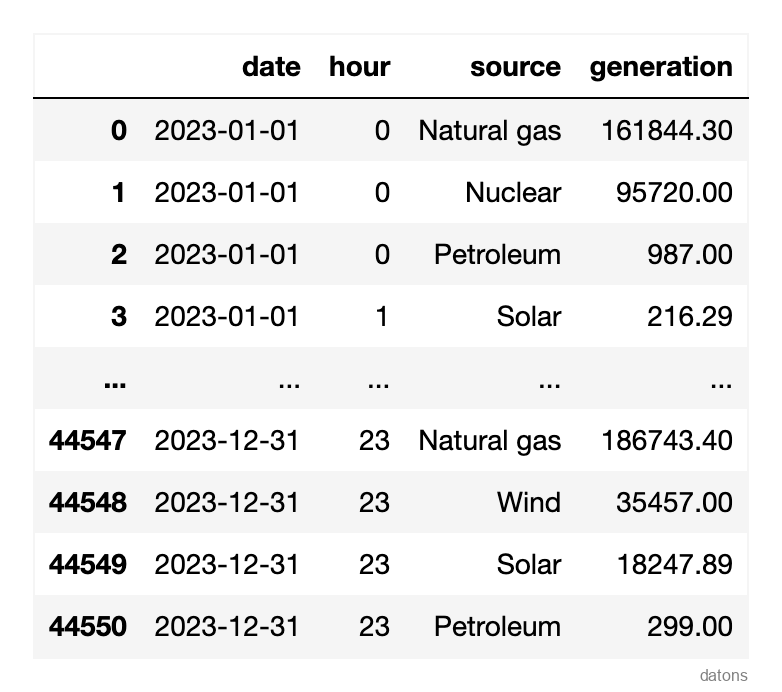
Questions
- How can we transform a DataFrame from long to wide format?
- Which function summarizes data into categories?
- How do we visualize data trends through a heat matrix?
Methodology
GroupBy to Summarize Data into Categories
Before writing the code to group the data, consider which columns are categorical and which are numerical:
- Categorical columns contain the categories for grouping the data.
- Numerical columns contain the values on which mathematical operations will be applied.
In energy generation analysis, it’s crucial to identify the sources used to produce electricity each hour. This helps measure, for example, the utilization rate of renewable versus non-renewable sources. Therefore:
- Categorical columns:
hour,source - Numerical columns:
generation - Mathematical operation:
sum
sr = df.groupby(['hour', 'source']).generation.sum()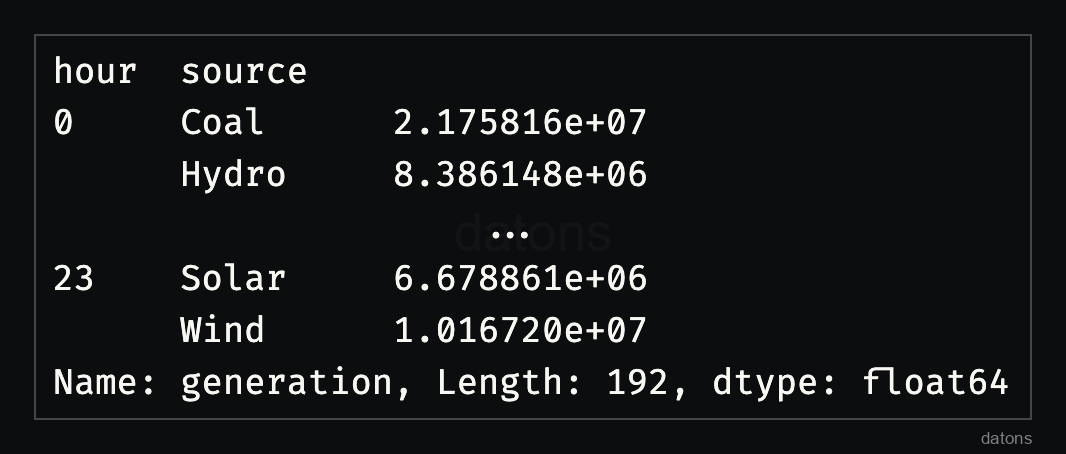
With 192 rows spread across 24 hours and [X] sources, can you spot the differences? It’s challenging at a glance, so let’s unstack the DataFrame.
Unstack Row Categories to Columns
Instead of having sources as rows, we’ll unstack them
into columns for a comprehensive view of energy generation by source and
hour.
Would this be interesting to one of your friends? Share it with them.
dfr = (df
 .groupby(['hour', 'source'])
 .generation.sum()
 .unstack('source')
)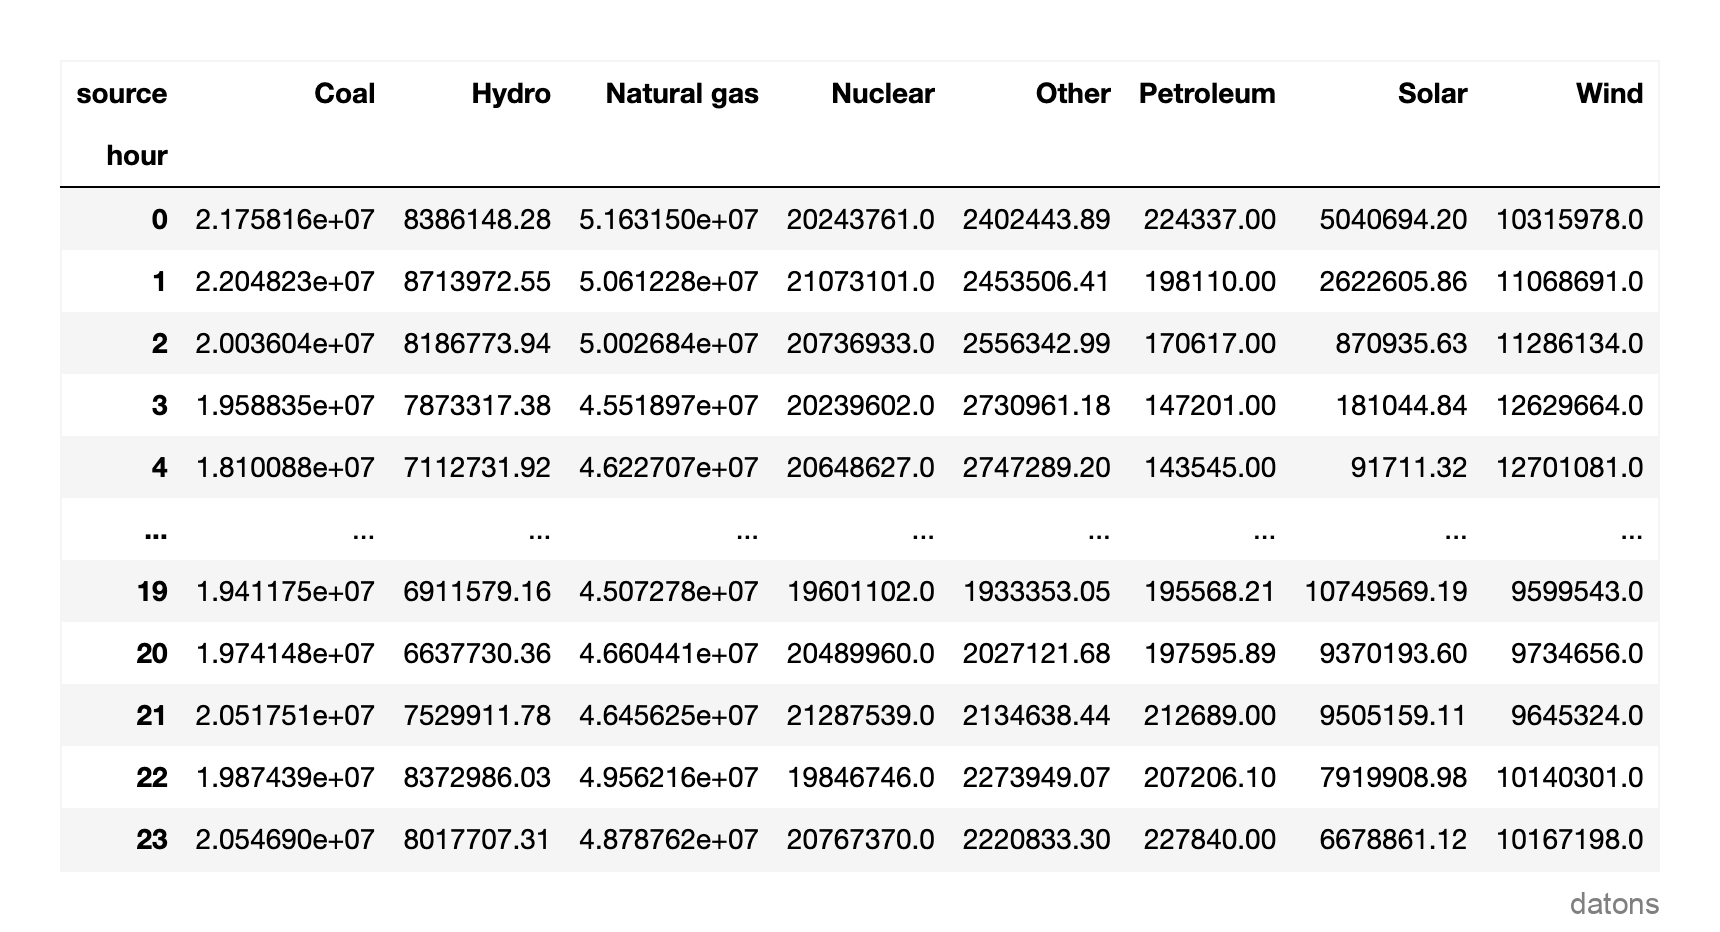
Now, we have a more compact view, but it’s still hard to discern which sources are most used based on the hour. Let’s proceed to create the heat matrix.
Heat Matrix with Background Gradient
Following the guidelines from this tutorial on styling a DataFrame to create a heat matrix, we’ll highlight the maximum values in TWh (dividing by 1 million since the values are in MWh) with a gradient background.
From the heat matrix, it’s observable that solar energy production exceeded 10 TWh from the 17th to the 19th hour.
Which other insights can you spot? I’ll read you in the comments!
Conclusions
- Long to Wide Transformation: Unstacking rows into columns effectively transforms the DataFrame, providing a clearer, panoramic view of data.
- Data Summarization: Using
groupbyandsumoperations allows for concise data categorization, essential for analysis. - Heat Matrix Visualization: Styling DataFrames with
a
background_gradientaccentuates key trends, making insights more accessible.
Instead of using two functions: groupby and
unstack, you could utilize the pivot_table
function to achieve the same outcome. See the tutorial here.
I’d love to hear your thoughts to further enhance our future articles.
What did you find most interesting/valuable in this piece?
Are there any topics you’d like us to cover in the future?
Your feedback is crucial to generate high-quality content that aligns with your needs and interests.
Thanks for your attention and support in advance!


