FRED data is frequently updated. Every time you want to update your analysis, you need to download the data again.
For example, the Inflation (CPI) data is updated monthly.
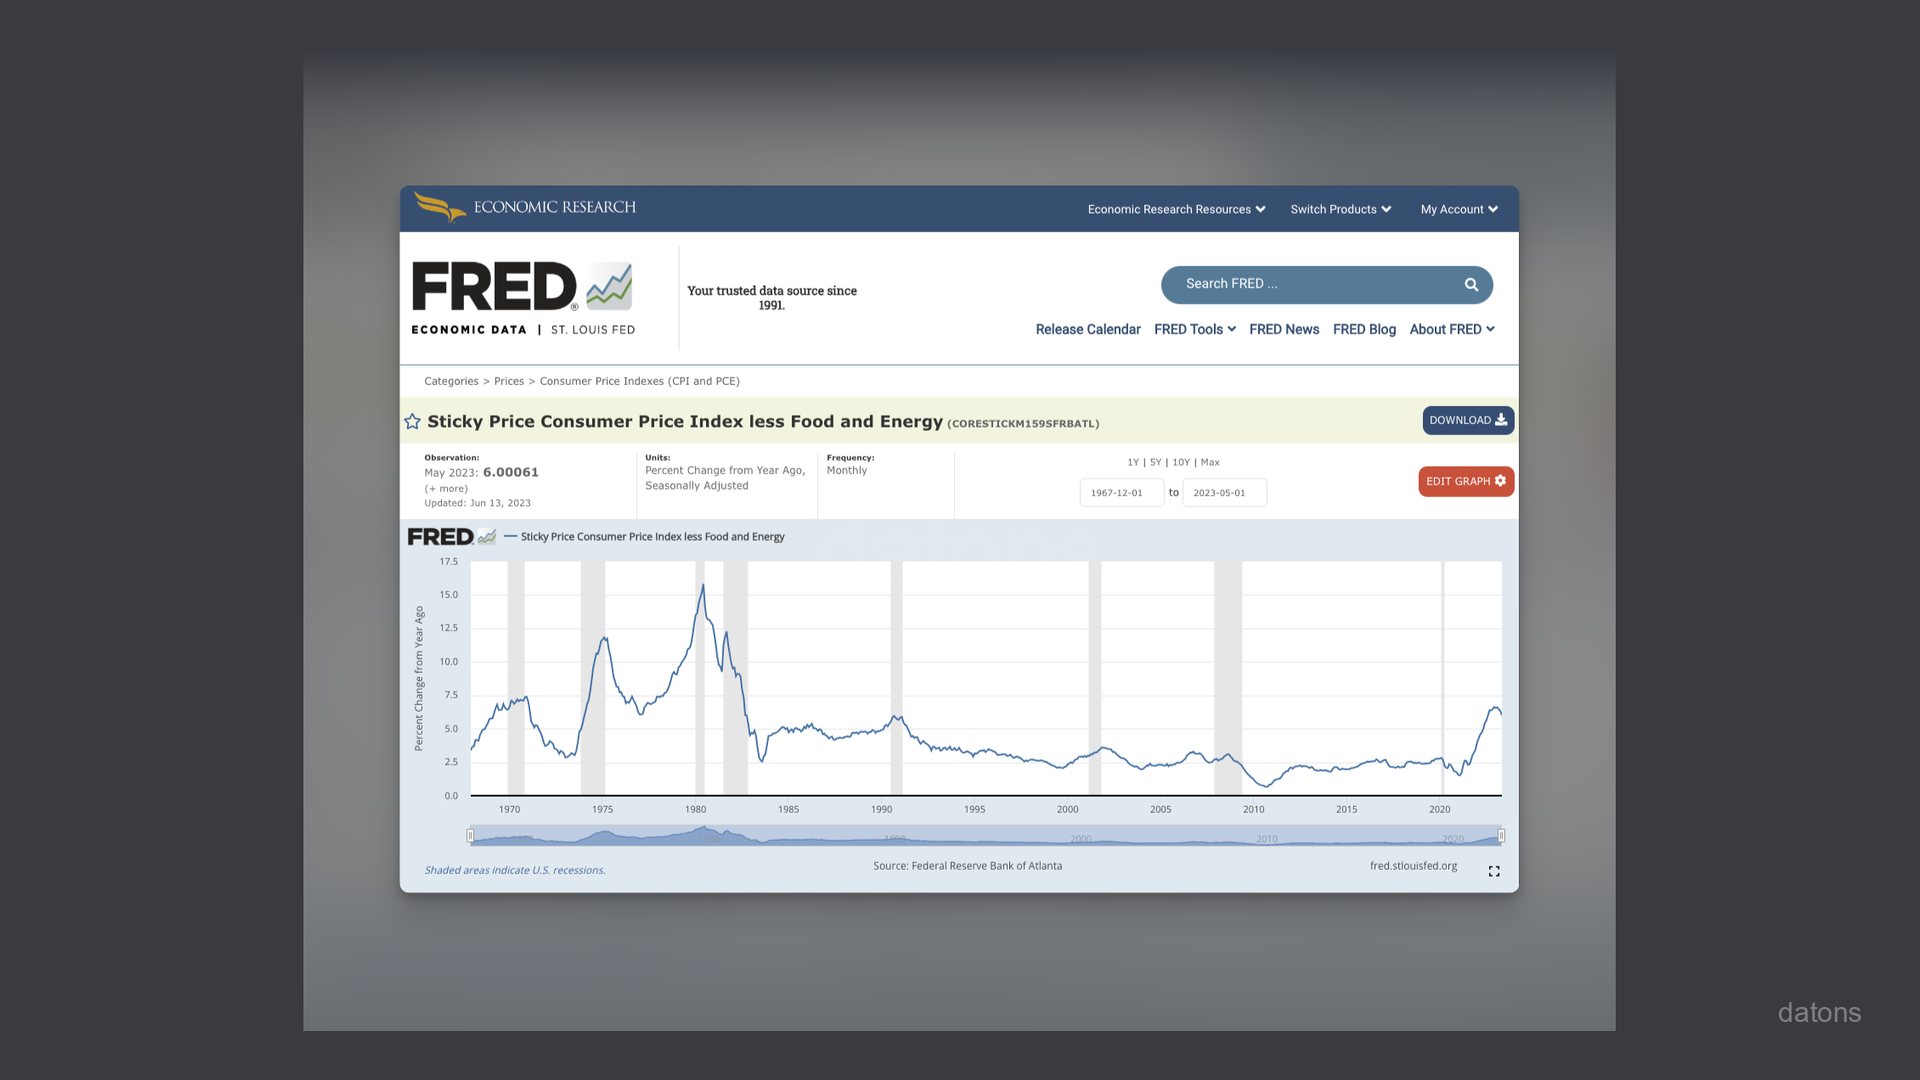
Instead of downloading the Excel file manually, and clicking through the menus to reproduce the chart, you can automate the process using Python. How?
In this tutorial, we’ll explain it to you step by step.
Questions
- How to identify indicators from FRED website?
- How to use FRED API to download data programmatically?
- How to build a table from API response data?
- How to export data into an Excel file?
- How to refactor code into a function to avoid repetition?
- How to download multiple indicators automatically?
- How to merge multiple tables into a single one?
Methodology
FRED API documentation
It is recommended to visit the official FRED API documentation to understand how the indicators are organized.
In our case, we will use the endppoint fred/series/observations
to obtain the Inflation (CPI) data, which is the indicator you saw in
the chart above.
Following the instructions for the endpoint, we can provide three parameters:
api_keyseries_idfile_type
In addition to the URL and the endpoint, which are the following:
URL_BASE = 'https://api.stlouisfed.org/'
ENDPOINT = 'fred/series/observations'
URL = URL_BASE + ENDPOINT
Before creating the parameters in Python, ensure you have an API key, provided by FRED. If you don’t, follow these instructions to get one.
Otherwise, you will get an error because FRED don’t allow anonymous requests to the API.
Request data from FRED API
To get data from internet locations (URLs), we will use the Python
library requests.
The following code composes the URL to get the CPI based on the
indicator CORESTICKM159SFRBATL: import requests
API_KEY = 'YOUR_API_KEY'
INDICATOR = 'CORESTICKM159SFRBATL'

params = {
    'api_key': API_KEY,
    'series_id': INDICATOR,
    'file_type': 'json'
}

res = requests.get(URL, params=params)
data = res.json()
data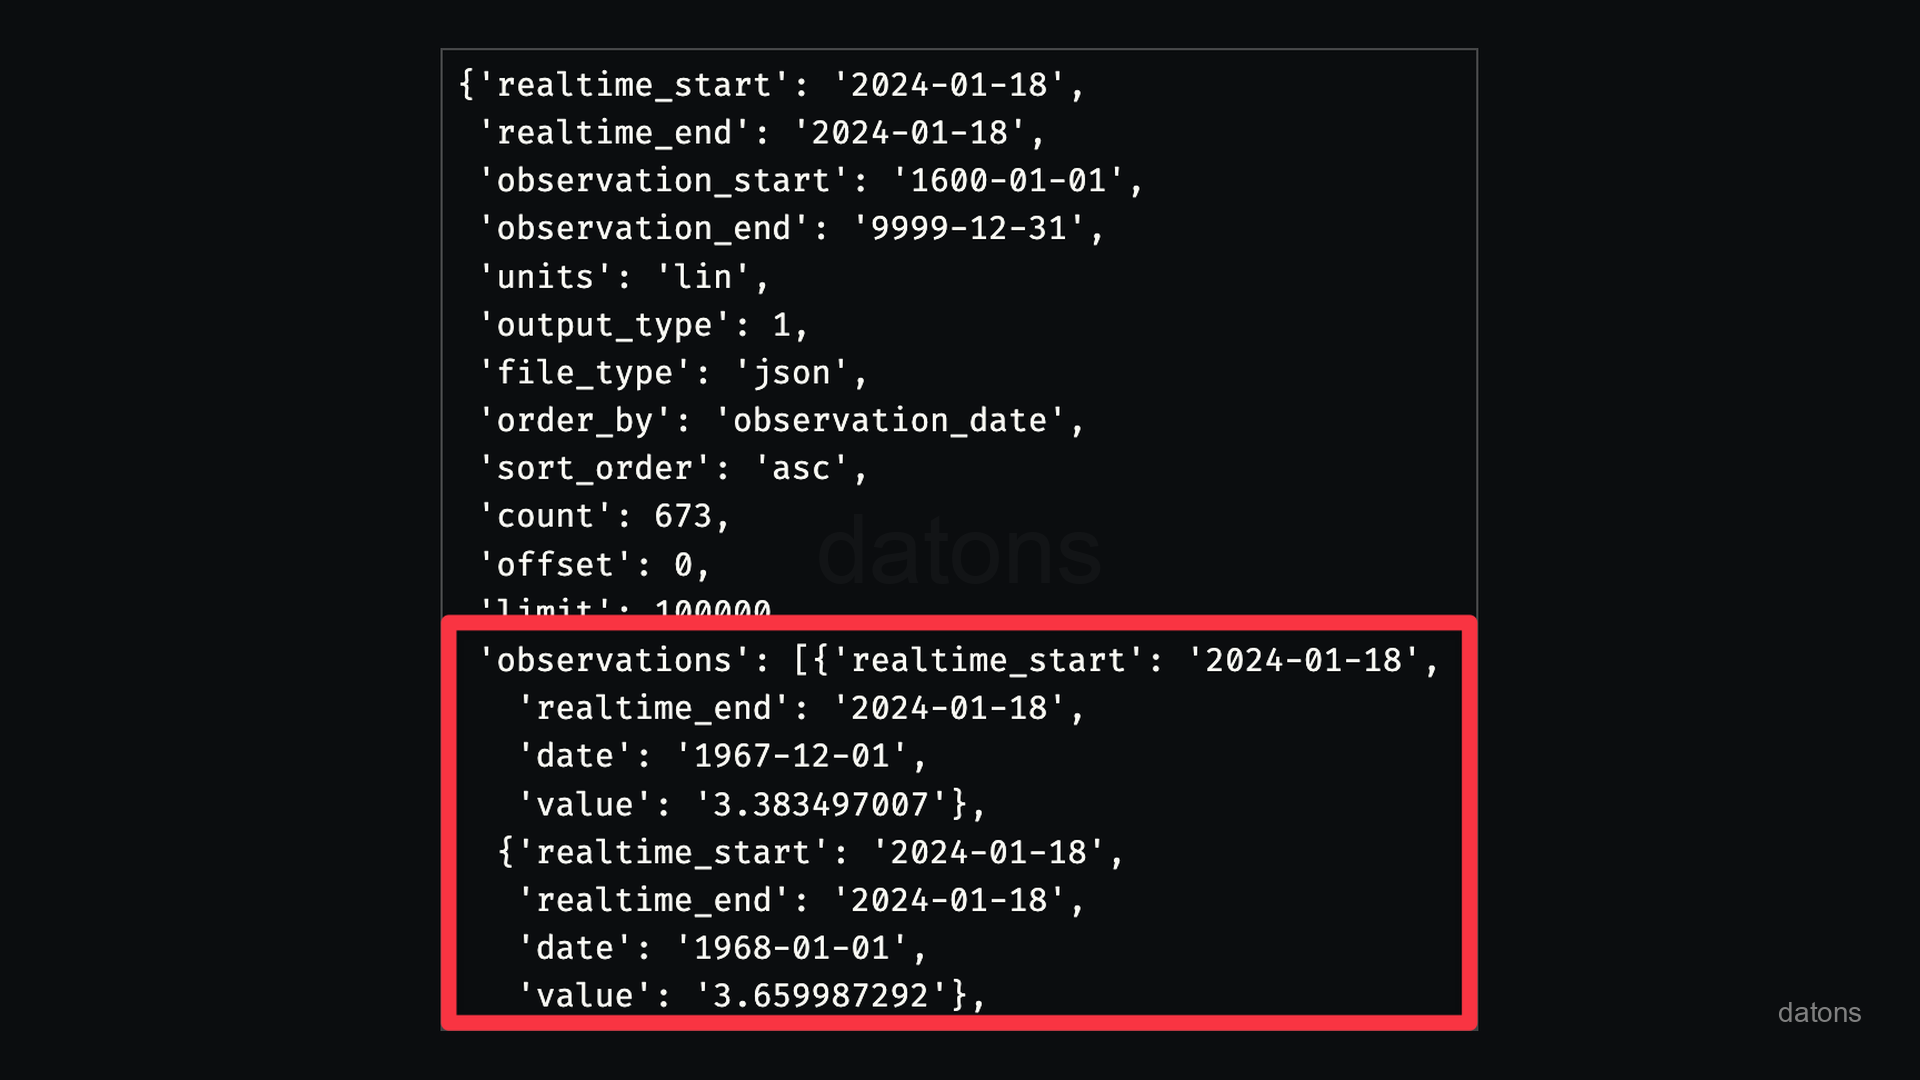
Build table from API response data
As you can see, the response from the API is not represented in a
tabular format. It is a JSON object. Therefore, we need to
transform it into a table to analyze it.
The following operations are executed in the subsequent lines of code:
- The
JSONresponse obtained is converted into aDataFramefrompandaslibrary. - The
DataFrameis then preprocessed and refined to have simple and working data.
import pandas as pd

df_cpi = (pd
 .DataFrame(data['observations'])
 .drop(columns=['realtime_start', 'realtime_end'])
 .rename(columns={'value': 'CPI'})
 .astype({'date': 'datetime64[ns]'})
 .set_index('date')
 .apply(pd.to_numeric)
 )

df_cpi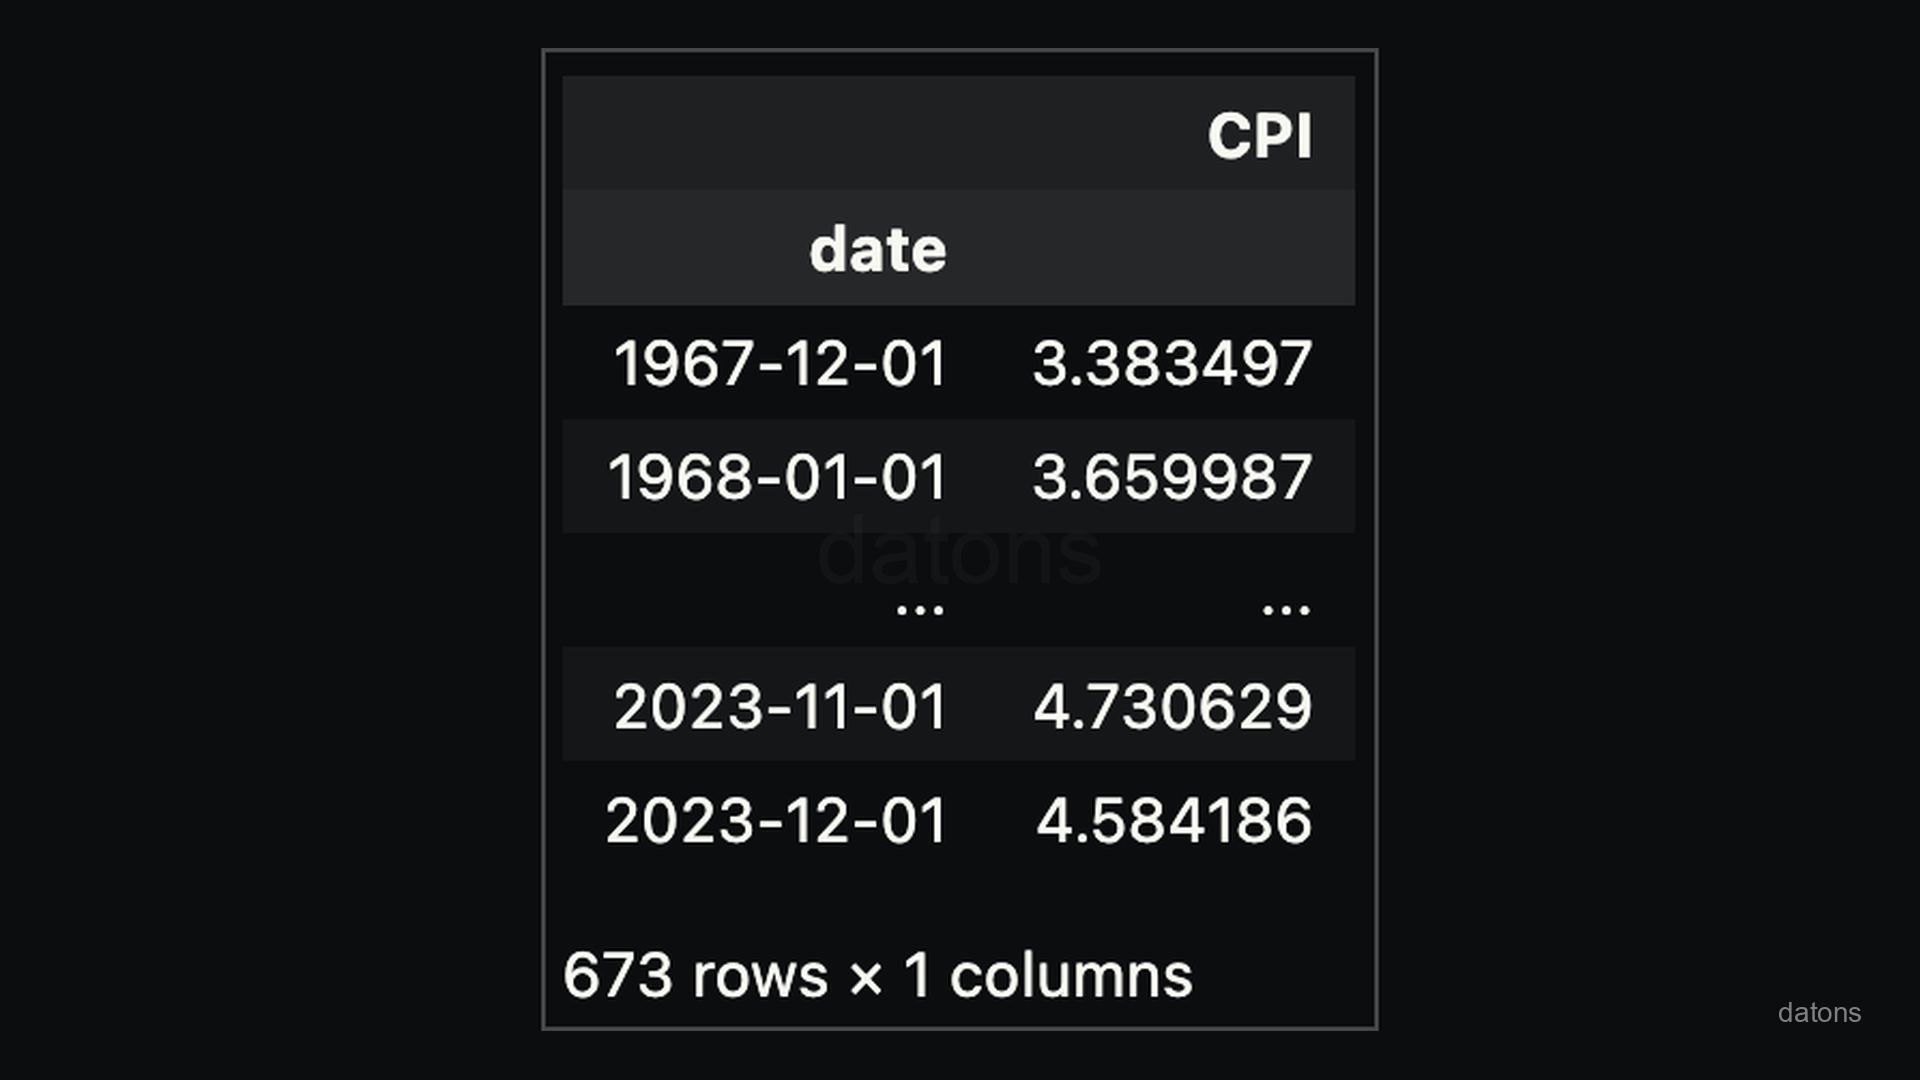
Export data to Excel
If you are familiar with Excel, you can export the data to an Excel file to analyze it there.
df_cpi.to_excel('FRED_CPI.xlsx')Now, what if we’d like to download another indicator such as the
MORTGAGE30US?
Are we going to repeat the same code again?
Of course not! We can create a function to automate the process.
Refactoring the code into a function
Since just a single economic indicator might not suffice for a comprehensive analysis. To enhance our data acquisition capabilities, we should refactor our code into a function.
The following function will allow us to retrieve any indicator as per our needs.
import requests

def indicator_data(
    indicator = 'MORTGAGE30US',
    api_key='YOUR_API_KEY',
    endpoint='fred/series/observations',
    column_name='value'
    ):

    URL_BASE = 'https://api.stlouisfed.org/'
    URL = URL_BASE + endpoint

    parameters = {
        'api_key': api_key,
        'series_id': indicator,
        'file_type': 'json'
    }

    res = requests.get(URL, params=parameters)
    data = res.json()

    df = (pd.DataFrame(data['observations'])
     .drop(columns=['realtime_start', 'realtime_end'])
     .rename(columns={'value': column_name})
     .astype({'date': 'datetime64[ns]'})
     .set_index('date')
     .apply(pd.to_numeric)
     )

    df.to_excel(f'FRED_{column_name}.xlsx')

    return df
Fetching multiple indicators automatically
Instead of repeating all the previous lines of code, we call the function to fetch the information for two indicators by just providing the indicator codes.
- Consumer Index Price (CPI):
CORESTICKM159SFRBATL - Mortgage Rate:
MORTGAGE30US
Additionally, we merge the datasets based on the date
time index of both DataFrames to display them in a single
table.
df_inflation = indicator_data(indicator='CORESTICKM159SFRBATL', column_name='CPI')
df_mortgage = indicator_data(indicator='MORTGAGE30US', column_name='MR30US')

df = pd.merge(
    left=df_inflation, right=df_mortgage,
    left_index=True, right_index=True, how='outer')

df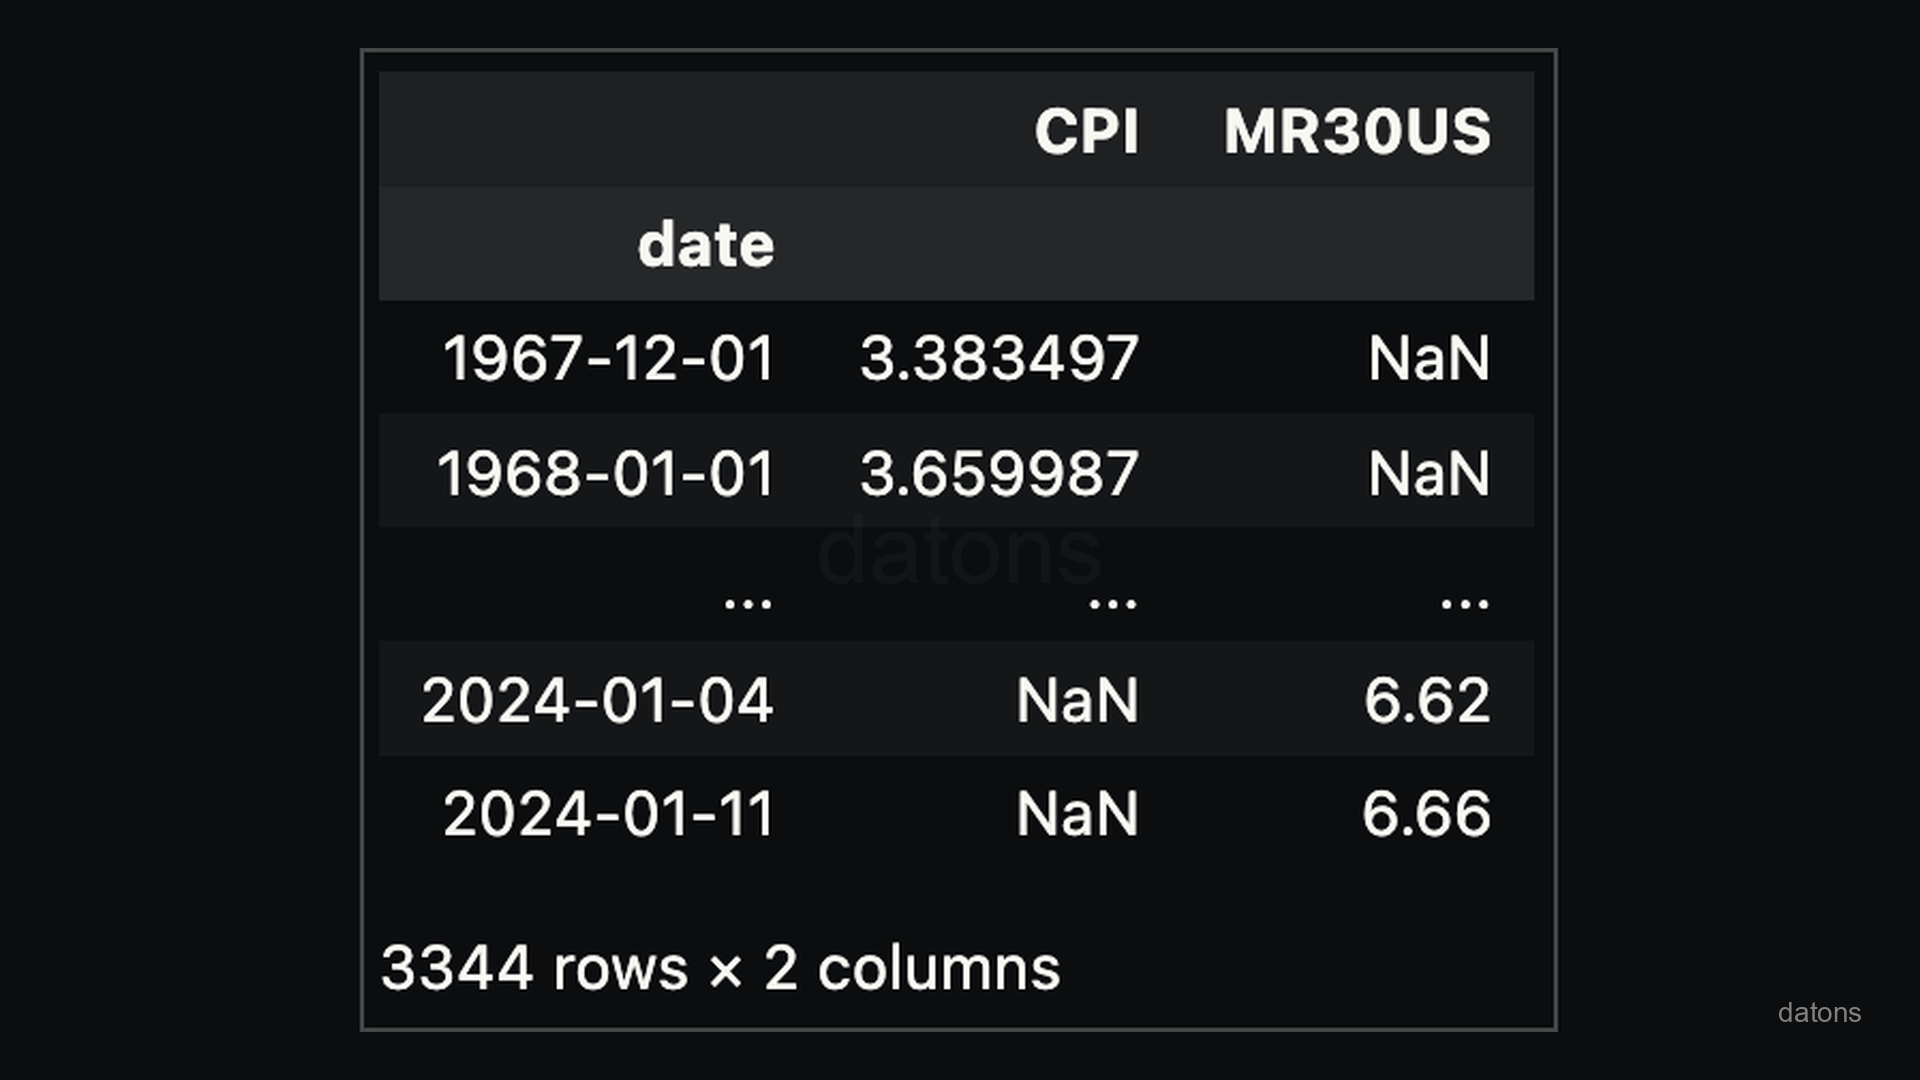
There is a presence of missing data NaN because the
information of the indicators isn’t retrieved at the same period:
CPI is monthly, while the MR is weekly.
This problem makes our data unfit for analysis. For example, if we try to create a plot, we don’t see most of the CPI data:
df.plot(color='variable')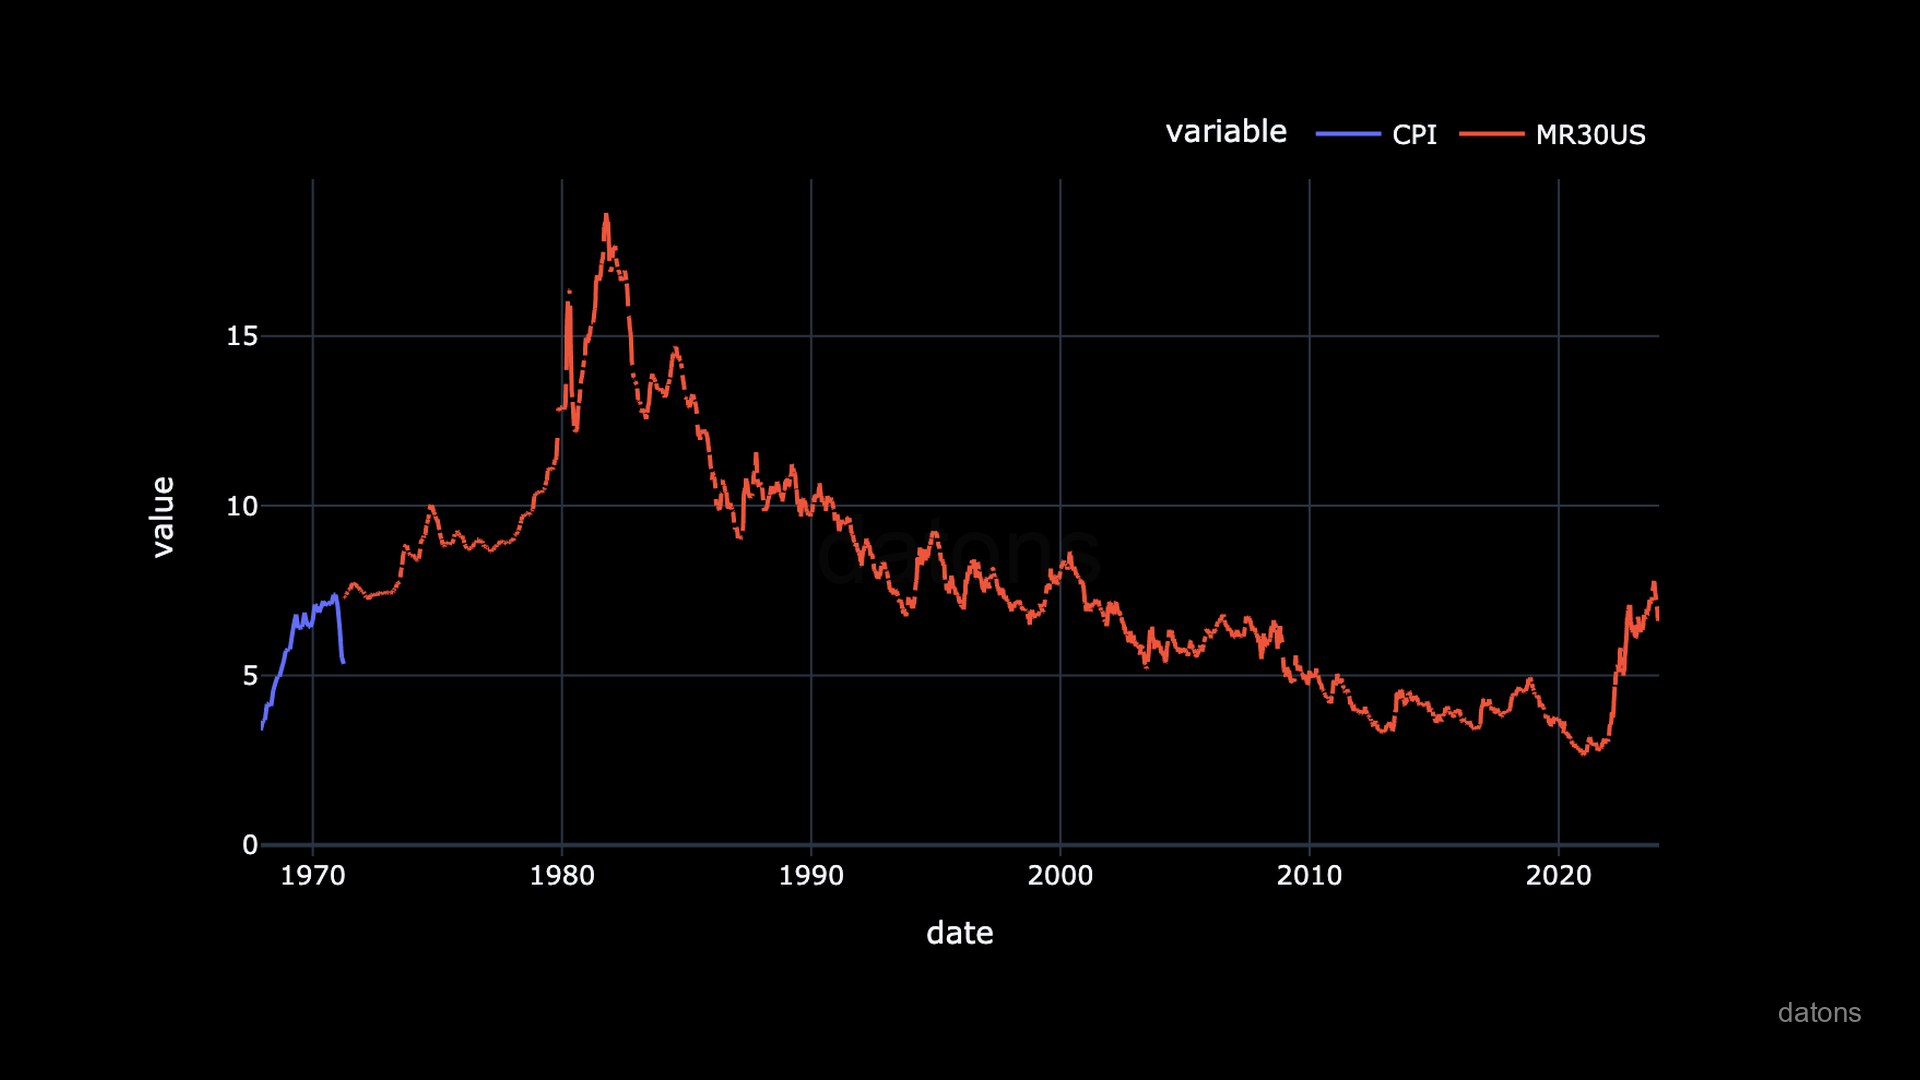
Conclusions
Instead of downloading the FRED data into an Excel file manually, and clicking through the menus to reproduce the chart, you know how to automate the process using Python.
In this tutorial, you’ve learned how to:
- Identify indicators from FRED website.
- Use FRED API to download data programmatically.
- Build a table from the API response data.
- Export the data into an Excel file.
- Refactor the code into a function to avoid code repetition.
Still, there is a problem with the indicators don’t have the same frequency.
In the next post, we’ll show you how to interpolate to
fill the missing data with reasonable values.
Before, let’s export the data into an Excel file to load it on the following tutorial.
df.to_excel('FRED_CPI-MR30US.xlsx')

